Ethereum Price Analysis – Neutral to bullish for the first time in almost six months


Technicals are beginning to lean neutral to bullish for the first time in almost six months. Momentum now favors a mean reversion of price towards US$340-US$355. However, the overall trend remains bearish so long as price is below the daily 200EMA and below the daily Cloud.
Ethereum (ETH) has begun to rise again as volume has slowly begun to increase on many exchanges. Overall, the crypto asset remains down 85% from the US$1,420 record high on January 13th. The market cap stands at US$21.38 billion, with US$1.4 billion traded in the past 24 hours. This leaves ETH ranked third by market cap, below XRP and above BCH.
Ethereum’s DevCon4 conference occurred from October 30th to November 2nd in Prague, Czech Republic. Vitalik Buterin shared his vision for Ethereum 2.0 which will include; pure Proof of Stake (PoS) consensus, faster time to synchronous confirmations, 10-20 minutes economic finality, and 1000x higher scalability.
The current roadmap for Ethereum includes changes major changes to the consensus algorithm and block rewards in the coming months. EIP 1234 will reduce the block reward to 2 ETH/block and delay a difficulty increase, and will be implemented in the Constantinople hard fork, which was slated for October 30th. Recent problems discovered while testing the changes on the Ropsten testnet have pushed back the hard fork to January 2019 at the earliest.
Further down the pipeline is Casper, which will drastically alter the ETH network. A new white paper for Vlad Zamfir’s Correct-by-Construction Casper was released earlier this week. A hybrid version of Casper will change the consensus algorithm from solely PoW to PoW and PoS and is set for 2020. The fork will also change the block rewards for PoW and PoS to 0.6 and 0.22ETH/block, respectively. The full implementation of Casper is slated for 2022 which will remove PoW altogether, leaving the PoS block reward at 0.22ETH/block for stakers.
Other highlights from the conference included discussion regarding ETH’s new smart contract language Vyper, scaling for ETH dApps with Ethermint, and smart contract gas optimization with Yul. A decentralized identity network was also discussed by E. Glen Weyl, which will help fight against the threats of authoritarian governments and corporate monopolies.
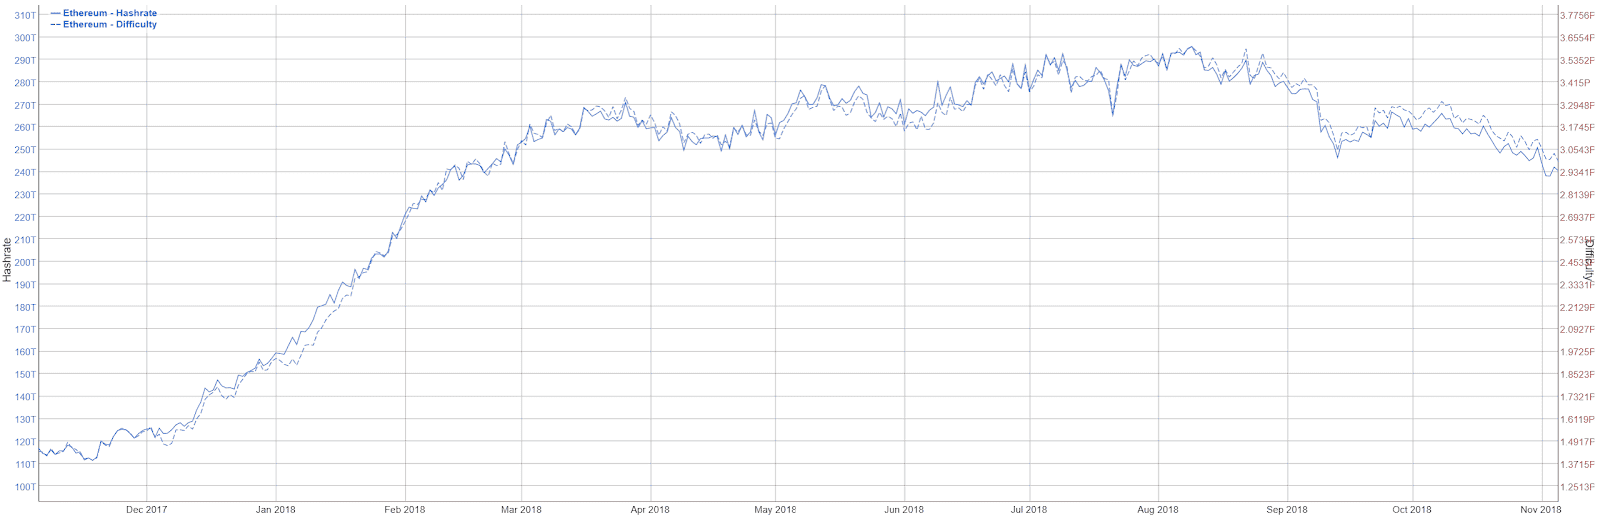
On the network side, hash rate and difficulty have both declined significantly since early August, and are now at levels last seen in February 2018. Block times, block reward, price, and transaction fees all effect mining profitability, which is currently near all time lows. The network node count is currently 13,440, 42% of which are located in the U.S., and many of which are run by Infura.
Node services like Infura add a degree of centralization to the network but become increasingly necessary as blockchain size increases. ETH has several sync modes, with fast sync exceeding 112GB and full sync exceeding 1TB.
The current number of transactions per day on the network (line, chart below) stands at 550,000, up from a yearly low of 500,000. Average transaction value (fill, chart below) has fallen dramatically through the year, currently at US$727, down from a high of US$20,000 in June 2017. Pending transactions are currently falling and below 80,000 with average transaction fees declining to a new yearly low at US$0.15 (not shown).

Source: Coinmetrics.io
The 30-day Kalichkin network value to estimated on-chain daily transactions (NVT) ratio (line, chart below) has been in decline since June 13th, but is on the rise again, and is nearing a three year high. Inflection points in NVT can be leading indicators of a reversal in asset value. A clear downtrend in NVT suggests a coin is undervalued based on its economic activity and utility, which should be seen as a bullish price indicator, whereas an uptrend in NVT suggests the opposite.
Daily active addresses (fill, chart below) have declined since January, but remain well above 2017 levels. Active and unique addresses are important to consider when determining the fundamental value of the network based on Metcalfe’s law. Unique ETH addresses continue to grow at a rapid rate and are above 46 million. While addresses can never be deleted, this metric indicates a growing use of the Ethereum blockchain. ETH-related job postings on LinkedIn are slightly above 350, down from 1,000 postings in July. There are also more than 3,980 Ethereum groups on meetup.com.

Source: Coinmetrics.io
Initial Coin Offering (ICO) misconduct continues to be one of the main focuses of the U.S. Securities and Exchange Commission (SEC), as outlined in their most recent annual report. The SEC brought over a dozen stand alone enforcement actions throughout the fiscal year 2018. There were also two settled orders against an unregistered broker-dealer who participated in unregistered offerings.
Fundraising was in the news this week, as five different sources are reporting vastly different numbers for 2018. The sources interviewed in the article suggested that there is currently no incentive to report raises accurately.
According to CoinSchedule, there have been a total of 938 ICOs thus far in 2018, which have raised a total of US$21.7 billion. The month of May saw the most ICOs, with 144, while September saw the least, with 56. In 2017, ICOs raised a mere US$3.88 billion, with only US$95 million raised in 2016. Total raises in 2018 still exceed US$10 billion even when the top 10 raises are excluded.

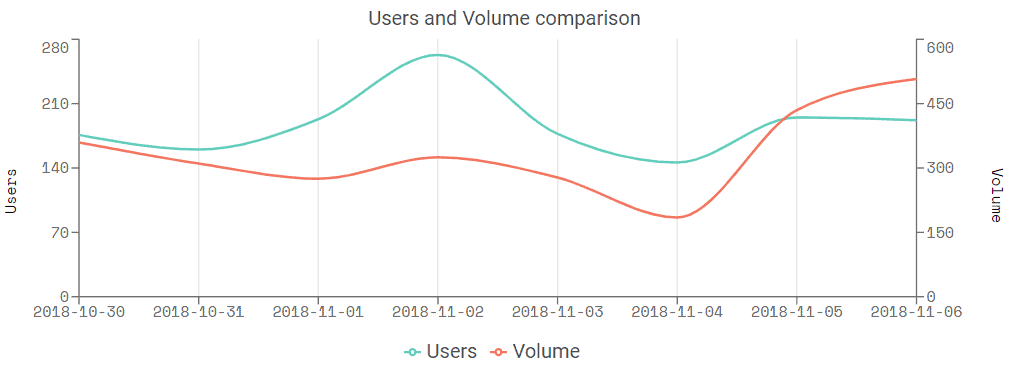
The top dApps over the past week, ranked by volume, continue to be dominated by decentralized exchanges and gambling apps. IDEX and ForkDelta had the highest number of users over the past week. Augur also saw a bump in usage with the rise of betting markets surrounding the U.S. midterm elections. A relatively stable ETH price has also allowed Augur users to avoid volatility risk exposure. Among all dApps in the game category, CryptoKitties continues to dominate user, volume, and transaction metrics. CryptoKitties also recently raised $15 Million from Venrock, Google, and Samsung.

Source: dappradar.com
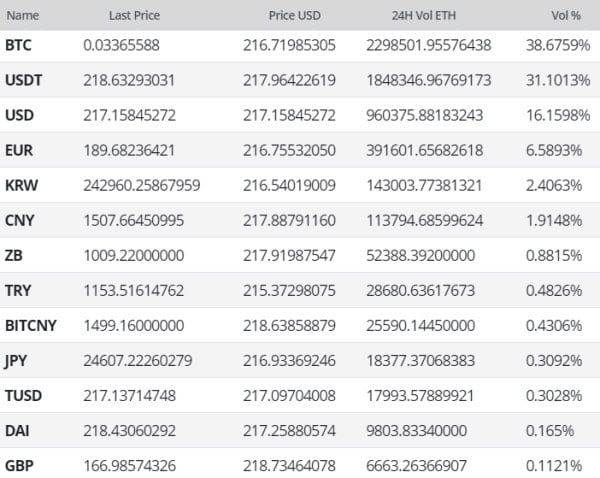
In the markets, ETH exchange traded volume in the past 24 hours has predominantly been led by the Bitcoin (BTC), Tether (USDT), and U.S. Dollar (USD) pairs. The majority of trading occurred on OKEx, LBank, Bitfinex, Huobi, and Binance. Trading volumes on Binance and Bitfinex are down significantly when compared to recent months.
In Asia, the Yuan (CNY), the Korean Won (KRW), and the Yen (JPY) pairs hold essentially no premium over the USD pairs. Together, all three regions show relatively low interest in their fiat pairs, with ~4.5% of the total traded volume combined. Dai volume has continued to slowly increase over the past few weeks but continues to remain a fraction of total traded volume.
The over the counter (OTC) exchange LocalEthereum facilitated 2,322ETH in transaction volume over the past week, up significantly from prior weeks. In comparison, LocalBitcoins exchanged 8,839BTC in the past week. While traditional OTC desks often require a minimum order of between US$100,000 and US$250,000, these peer-to-peer marketplaces have no minimum order size.
Technical Analysis
The 50/200EMAs on the daily chart have been bearishly crossed for 152 days, resulting in a steady decline of over 65%. This bearish Death Cross and the opposing bullish Golden Cross are significant events for many traders and dictate the direction of the trend going forward. The previous Golden Cross in May was overshadowed by a bearish reversal pattern, the head and shoulders. Although the EMA cross is bearish, the 200EMA will act as a mean reversion level for price, currently at US$355.
Total long/short open interest is net long and near record highs on Bitfinex, with long positions at elevated levels relatively. Shorts have decreased by almost 50% in the past week. A significant price movement downwards will result in an exaggerated move as the long positions will begin to unwind. While there are no active RSI or volume divergences, RSI has broken strongly above 50 for the first time since May, suggesting a flip in momentum from bearish to bullish.

Price also remains bound to a bearish Pitchfork with anchor points in December, March, and May. Price will continually test the median line as either support or resistance until price closes above or below the Pitchfork. The volume profile of the visible range also shows the current price zone, or orderblock, has had the most cumulative buy and sell volume since April 2016. A break of the previous local low at US$170 would potentially see a decline to US$65 based on the historic volume profile.

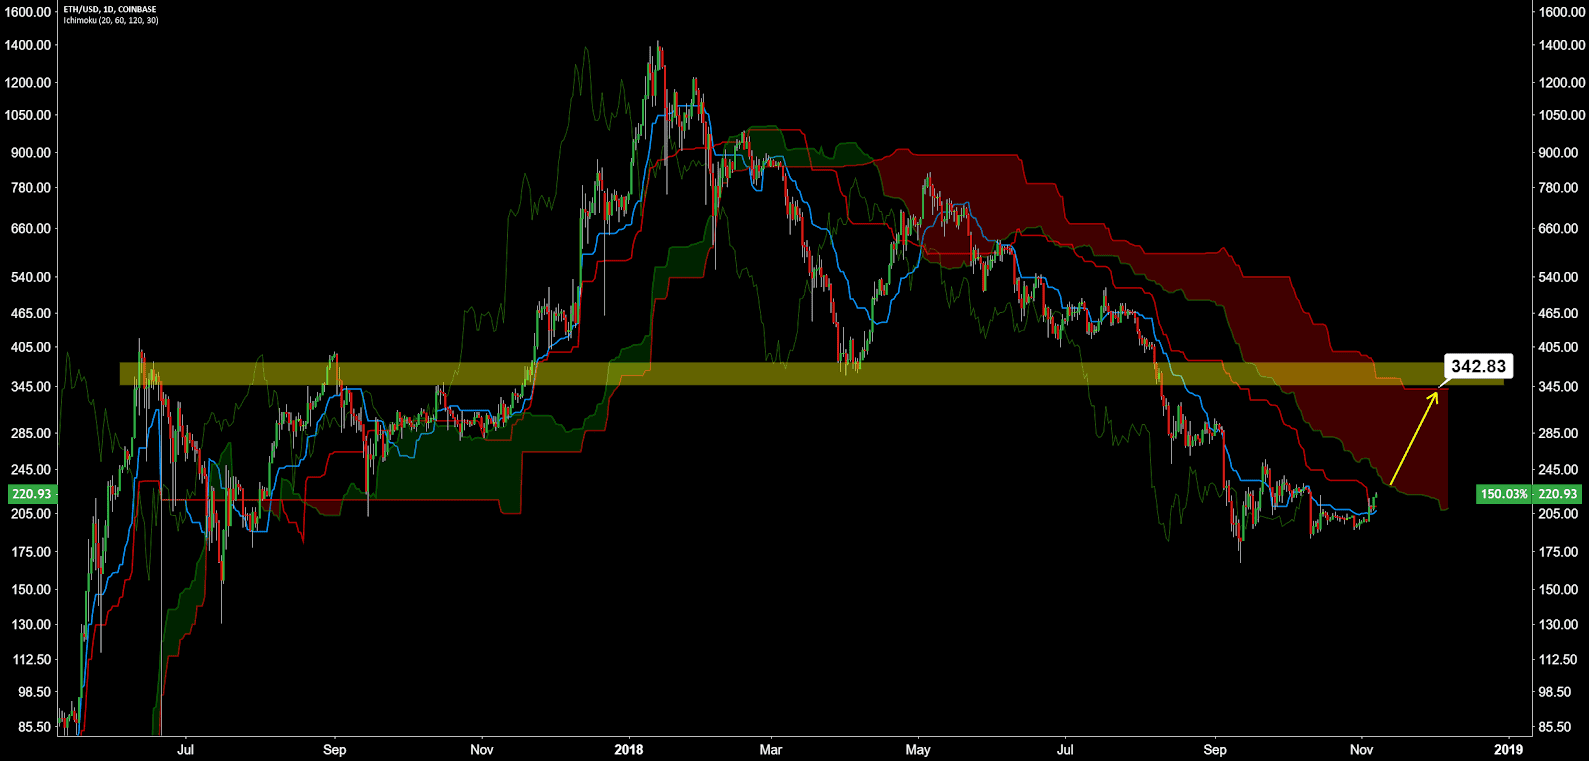
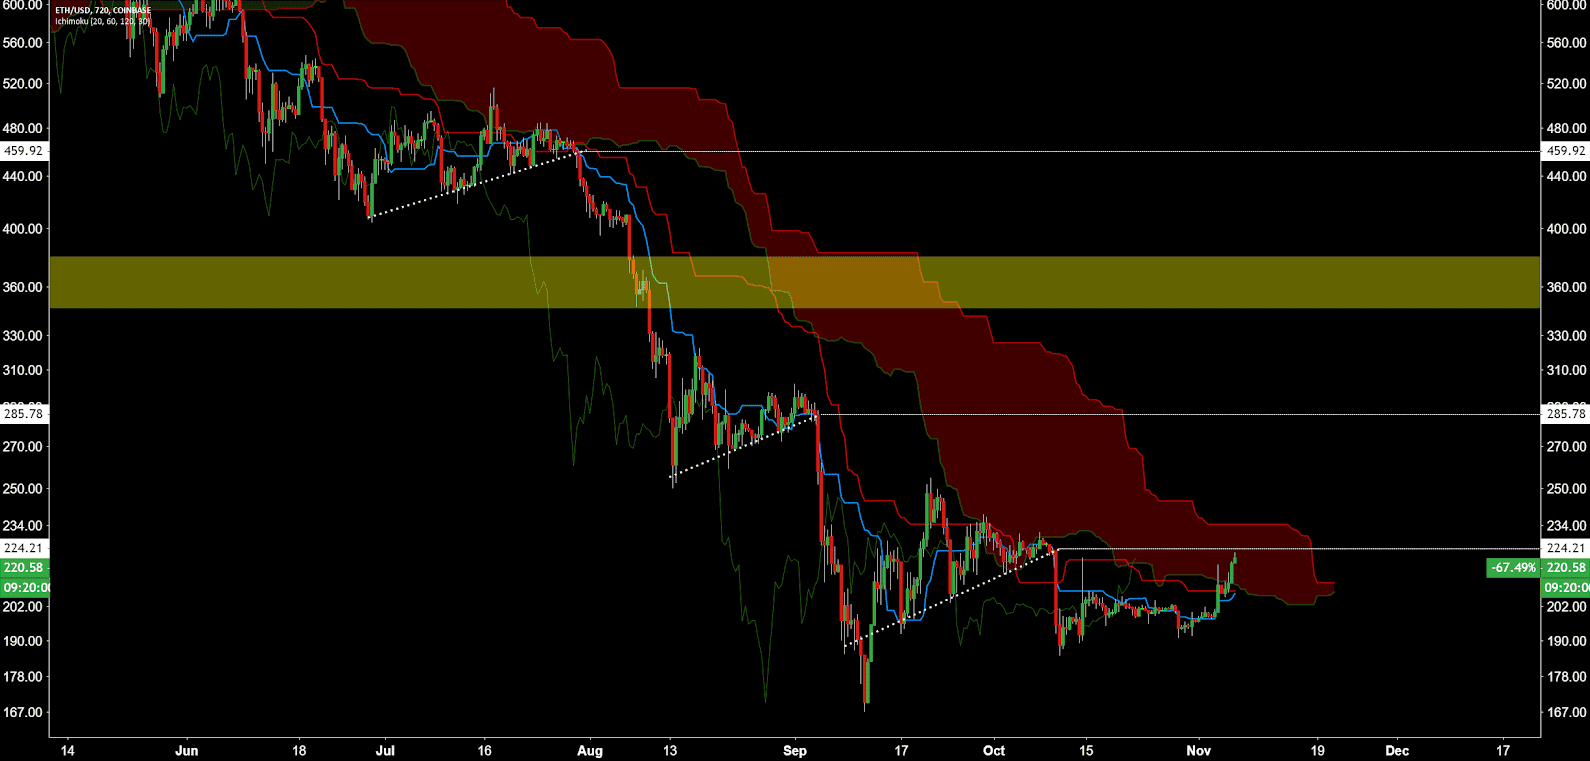
Turning to the Ichimoku Cloud, four metrics are used to determine if a trend exists; the current price in relation to the Cloud, the color of the Cloud (red for bearish, green for bullish), the Tenkan (T) and Kijun (K) cross, and the Lagging Span. The best entry always occurs when most of the signals flip from bearish to bullish, or vice versa.
The status of the current Cloud metrics on the daily time frame with doubled settings (20/60/120/30) for more accurate signals are bearish; price is below Cloud, Cloud is bearish, TK cross is bearish but nearly bullish, and Lagging Span is below Cloud and below price. A traditional long entry will not trigger until price is above the Cloud.
As the TK cross turns bullish and price enters the Cloud, a long reversal trade (yellow arrow) will trigger with an entry near US$222 with a target of US$342. This is known as an Edge to Edge trade. Strong horizontal resistance also sits between US$350-$400 based on historic price action.
The status of the current Cloud metrics on the twelve hour daily time frame with doubled settings (20/60/120/30) for more accurate signals are neutral; price is in Cloud, Cloud is bearish but nearly bullish, TK cross is bearish but nearly bullish, and Lagging Span is below Cloud and above price.
Again, a traditional long entry will not trigger until price is above the Cloud. However, price is approaching a decision point between bullish reversal and bearish continuation, based on the flat and thinning Cloud. A candle close above the Cloud would be the first on this time frame since May. Based on previous price cliffs throughout the downtrend, horizontal resistance is present at US$224, US$285, and US$460.
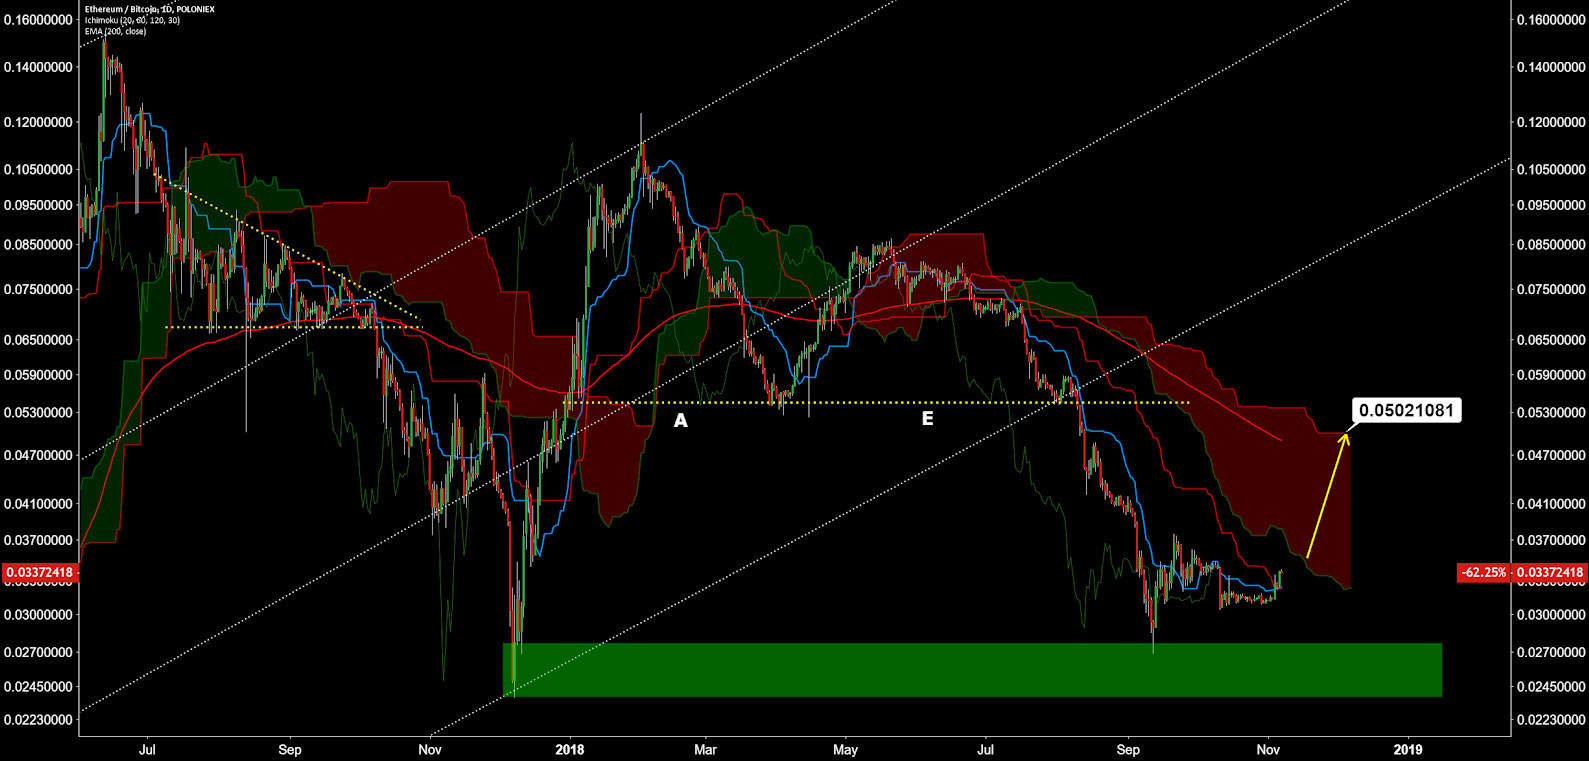
Lastly, on the ETH/BTC pair, price has largely been confined by several diagonal support and resistance zones since 2015. On August 10th, price dropped quickly after breaking the bottom support zone, which also completed a bearish inverted Adam and Eve double top chart pattern. The ratio appears to have found support near the last local low of ~0.026BTC. Cloud remains bearish with a recent bullish TK cross. There is a possibility of an Edge to Edge long trade from ~0.033BTC to towards 0.05BTC.
Conclusion
Much of the network fundamentals continue to depend on the direction and speed of the PoW to PoS transition as well as the reduction in inflation. A delay in the Constantinople hard fork is a short term blow to the network as inflation will remain above 7% until next year. Network use hasn’t decreased or increased significantly in recent weeks, with the average value of transactions continuing to decrease.
Technicals are beginning to lean neutral to bullish for the first time in almost six months. Momentum now favors a mean reversion of price towards US$340-US$355. However, the overall trend remains bearish so long as price is below the daily 200EMA and below the daily Cloud. Also, price will likely remain bound within the downtrending pitchfork for the next few weeks before bullish invalidation. ETH/BTC has a similar picture; a bearish trend headed for mean reversion.
 Brave New Coin reaches 1M+ engaged crypto enthusiasts a month through our website, podcast, newsletters, and YouTube. Get your brand in front of key decision-makers and early adopters in 2026. Limited slots remaining! Find out more today!


