Ethereum Price Analysis – Signs of continued growth


Based on unique addresses, nodes, and job listings, Ethereum shows signs of continued growth and usage throughout 2018 and 2019. If or how this will translate into price is not yet apparent. The next wave of bullish price action may well be driven by the numerous dApps making their way to market.
Ethereum (ETH) has had a volatile start to July, dropping 15% over the past three days. The market cap now stands at US$44.37 billion, with exchange-traded volume of US$1.85 billion in the past 24 hours.
Unique ETH addresses continue to grow at a rapid rate. While addresses can never be deleted, this metric does indicate growing use and need for the blockchain, many of these addresses have been created post-ICO mania. Reflecting this growth, ETH-related job postings on LinkedIn currently exceed 1,000.
 With 16,888 nodes, most of which reside in the U.S. and China, ETH has the largest network of any cryptocurrency. The storage space for a fully fledged ETH node, including all Parity operation modes with various chain data, now requires more than 600GB. However, nodes can be run in various flavors, and the smallest can be run on a free Amazon Web Service account with a 30GB drive.
 Transactions per day and transaction fees have spiked recently, correlating with the release of a voting system from the Chinese “decentralized” exchange, FCoin. Voting occurs through a “cumulative deposit number ranking” where users are encouraged to repeatedly deposit tokens to the exchange. Accusations that FCoin is likely a scam have surfaced, with users concerned that the exchange is manipulating markets.
This bump in transactions recently raised transaction fees dramatically. These fee market spikes can have a lasting ripple effect for all users, including those moving tokens or using dApps, and create a diminished user experience, decreasing on-chain network traffic.
 In response to the network’s heavy load, pending transactions have spiked to near 60,000, after declining throughout most of July. Pending transactions rose dramatically at various times throughout 2017 due to an influx of transactions during ICOs. The network was also crippled during the CryptoKitties dApp craze in December 2017.
 The 30-day Kalichkin network value to estimated on-chain daily transactions (NVT) ratio has been in decline since surpassing a two year high. Inflection points in NVT can be leading indicators for a reversal of an asset’s value. A clear downtrend in NVT suggests a coin is undervalued for its utility and should be seen as a bullish price indicator.
 Hashrate and difficulty increases have increased slightly over the past two months, and both have posted new records highs. ETH Proof of Work (PoW) mining will eventually become entirely impossible through the Casper Proof of Stake (PoS) transition. Vitalik Buterin’s Casper FFG is slated to go live as early as September of this year. This change also comes with a significant reduction in inflation, to about 500,000 ETH per year or 0.22 ETH per block.
Currently, just three mining pools, Ethermine (26%) SparkPool (17%), and f2pool (16%) control over 50% of the ETH hashrate. Two surprising entities have announced an interest in mining ETH; Google co-founder Sergey Brin and the Sacramento Kings, an American basketball team. Brin admitted earlier this week that Google “probably already failed to be on the bleeding edge” of blockchain tech.
 According to coinschedule.com, 583 Initial Coin Offerings (ICOs) thus far in 2018 have raised US$12.4 billion. Total funds raised in 2017 was a mere US$3.88 billion, with only US$95 million raised in 2016. Aside from March, these funding rounds have not surpassed US$2 billion each month.
The ICO world has often been touted as a new and improved crowdfunding or Venture Capital (VC) method. As ICO funding has decreased throughout most of 2018, despite a few large ICOs, deal value in the U.S. VC world has skyrocketed according to the National Venture Capital Association. The number of unicorns, or companies with a valuation over US$1 billion, is on pace for a record year.
 In the meantime, while the U.S. regulatory agencies have essentially deemed ETH “not a security”, the jury is still out for many ICOs, and more importantly, exchanges, who may fit under the umbrella of selling an unlicensed security. Much of the ICO fundraising has moved to private rounds or are excluding non-accredited U.S. investors entirely.
 According to dappradar.com, the top decentralized applications (dApps) by volume over the past week have all been decentralized exchanges; IDEX, Bancor, and ForkDelta. Decentralized exchanges help mitigate custodial and regulatory risk, but often lack the liquidity most traders have come to expect while using centralized exchanges. Most of the other top 10 dApps are related to exchanges or marketplaces for peer-to-peer trading.
Dapp news this week has been lead by Bancor (BNT), which reported a security breach resulting in the loss of ~25,000ETH and 3.2 million BNT. The stolen BNT was able to be frozen, leaving many users questioning the decentralized nature of the platform. No user wallets were compromised in the hack and the Bancor Network will likely be back online within the next day or two.
The Augur Platform (REP), a P2P prediction market, launched today and has already cracked the top 10 dApps over by ETH volume over the past week. On the mainnet, users are able to create potential betting scenarios for a fee in both ETH and REP, and earn a set fee. Users can also bet on existing scenarios brought forth by others and earn crypto when those scenarios expire.
The REP ICO occurred from Aug-Oct 2015 raising ~US$5 million at a US$0.60 token price. The coin currently holds a market cap of ~US$344 million at a US$31 token price with a circulating supply of 11 million tokens.
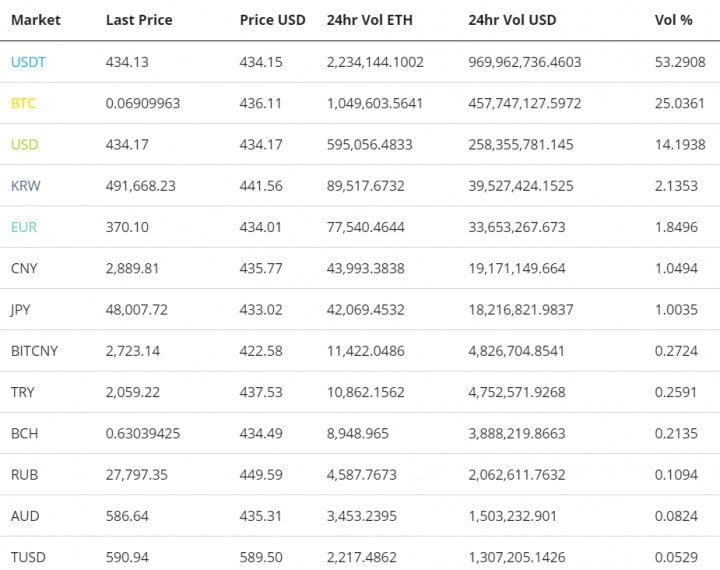
ETH exchange traded volume in the past 24 hours has predominantly been led by Tether (USDT), Bitcoin (BTC), and U.S. Dollar (USD) pairs. The majority of trading occurred on Bitfinex, OKEX, Binance, and Huobi. In Asia, the KRW trading pair holds a small premium, and CNY volume has exceeded JPY volume. Together, all three regions show relatively low interest in their fiat pairs.
 The over the counter (OTC) exchange LocalEthereum facilitated 1,346ETH in transaction volume over the past week, according to dappradar. In comparison, LocalBitcoins exchanged 8,151BTC in the past week, according to coin.dance. Traditional OTC desks often require a minimum order of between US$100,000 and US$250,000, whereas these peer-to-peer marketplaces have no minimum order size.

Technical Analysis
ETH and BTC have been highly correlated since January, with a correlation coefficient of 0.9. Trends for both top assets remain bearish. The key to finding successful trades will be determining if that trend will continue or if the trend is on the verge of turning bullish, using Exponential Moving Averages (EMAs), Pitchforks, Ichimoku Cloud and chart patterns. Further background information on the technical analysis discussed below can be found here.
ETH price recently broke above a bearish Pitchfork (PF) with anchor points in January, April, and May. The PF had been projecting a median line of ~US$300, which will be a high probability target if price continues to decline.
Price is also again flirting with a key area of previous resistance and support (yellow rectangle). A break below this level would very likely result in a touch of the PF median line (ML). The 50/200EMAs also remain bearishly crossed with price far below the 200EMA. Volume has been declining since March and continues to decrease. A convincing spike in volume will likely set a weeks-long trend.
 A bullish PF with anchor points in June 2017, January 2018, and April 2018 shows the previous local high being rejected at the PF ML. Price will continually attempt to return to the ML throughout any given trend. A breach of the ML on volume would suggest a move to the next diagonal resistance. Price currently sits on the last support diagonal. If price falls below this level, the PF will be invalidated.
 Turning to the Ichimoku Cloud, four metrics are used to determine if a trend exists; the current price in relation to the Cloud, the color of the Cloud (red for bearish, green for bullish), the Tenkan (T) and Kijun (K) cross, and the Lagging Span. The best entry always occurs when most of the signals flip from bearish to bullish, or vice versa.
The status of the current Cloud metrics on the daily time frame with singled settings (10/30/60/30) for quicker signals are bearish; price is below Cloud, Cloud is bearish, TK cross is bearish, and Lagging Span is below Cloud and price. A traditional long entry will not trigger until price is above the Cloud. The recent rejection at the Kijun is known as a bearish Kijun bounce and a signal for bearish continuation.
 The status of the current Cloud metrics on the daily time frame with double settings (20/60/120/30) for more accurate signals are also bearish; price is below Cloud, Cloud is bearish, TK cross is bearish, and Lagging Span is below Cloud and price. A traditional long entry will not trigger until price is above the Cloud.
The position of the TK lines shows a growing C-Clamp, which can be thought of as a bullish divergence, suggesting oversold conditions. If price does not make lower lows, a target of US$629 is likely. A flat Kumo at US$890 will also act as a magnet for price when price does return above the Cloud.
 The status of the current Cloud metrics on the four hour chart with double settings (20/60/120/30) for more accurate signals are also bearish; price is below Cloud, Cloud is bearish, TK cross is bearish, and Lagging Span is below Cloud and price.
A traditional long entry will not trigger until price is above the Cloud, which happened briefly for the first time since May, but the Kumo breakout was not accompanied by a bullish Cloud. This failed Kumo breakout illustrates the importance of waiting for all Cloud metrics to flip bullish, especially on lower time frames, before entering a long position.
A large falling wedge reversal chart pattern has potentially formed. Price will coil tighter and tighter in the drawn channel until price has substantial volume to move outside the boundaries. Triangles typically break after ¾ full, or around July 15th. The pattern holds a measured move and 1.618 fib extension of US$955 and US$1,132 respectively.

Conclusion
Based on unique addresses, nodes, and job listings, Ethereum shows signs of continued growth and usage throughout 2018 and 2019. If or how this will translate into price is not yet apparent. The next wave of bullish price action may well be driven by the numerous dApps making their way to market. However, based on the several random stress tests from different vectors over the past year, the network shows an inability to adequately scale to handle the need.
Technicals show a continued bear trend with no immediate reversal. Although the near term momentum indicators suggest oversold conditions, a reach for US$300 or lower remains possible. A strong break in diminishing volume over the past few weeks should give a definitive conclusion regarding bearish continuation or a relief rally.
Based on unique addresses, nodes, and job listings, Ethereum shows signs of continued growth and usage throughout 2018 and 2019. If or how this will translate intopriceis not yet apparent. The next wave of bullish price action may well be driven by the numerous dApps making their way to market.
 Brave New Coin reaches 1M+ engaged crypto enthusiasts a month through our website, podcast, newsletters, and YouTube. Get your brand in front of key decision-makers and early adopters in 2026. Limited slots remaining! Find out more today!


