NEO Price Analysis – Tumbleweeds on a dusty highway

![]()
The NEO token’s diminishing value has been accompanied by a concurrent fall in transaction volume and user activity. Whether NEO is going through a natural correction and can recover lost sentiment with future network development, remains to be seen, but its short-term outlook is nonetheless bearish.
Platform based blockchains such as NEO, Ethereum and TRON, may be the largest victims of the ongoing crypto bear market. FUD surrounding the relevance and demand for Dapps and ICOs, given a lack of consumer and commercial adoption, has emerged in waves.
The primary use case for platform based tokens like NEO has been as a fundraising tool to access and promote blockchain projects, and the lack of activity and tangible updates within projects like Augur and Ryucoin, has greatly affected the perceived value of these networks.
NEO is currently trading at ~$17.30, down ~90% from an all time high of $168.57 (index). It is down ~49% versus Bitcoin in the last year, and down ~55% in the last three months.
These numbers indicate the token’s deep fall from grace, and inability to maintain buyer appeal compared to a safe haven option like BTC.
In recent weeks, NEO has been in the news for an apparent failed bid to purchase the Bittorrent network, which was eventually sold to direct rival, Tron. This may have created some FUD surrounding the NEO token and partially contributed to bearish momentum.
Exchanges and trading pairs

The most popular trading pairs for NEO are crypto-to-crypto with the NEO/USDT, NEO/BTC and NEO/ETH pairs making up over 85% of NEO’s 24 hour volume, with almost 3 million tokens daily.
The next two most popular pairs are the fiat-to-crypto NEO/USD and NEO/KRW which make up over 10% of daily trades. Bitfinex handles ~99.5% of the NEO/USD volume, worth over USD 7 million.

The most popular exchange for the NEO/USDT is mega exchange Binance, it handles over 50% of the volume between the pair, close to a million tokens, worth ~USD 15 million.
The next most popular exchange is the controversial Bitforex, which has often been accused of misreporting trading volume and wash trading, so its reported numbers should be taken with a grain of salt.
Network monitor
The NEO network uses the internally designed, delegated byzantine fault tolerance consensus algorithm. The system has its advantages, the network likely has an increased security layer becaused transaction verifiers (in NEO, they are known as bookkeepers) are all permissioned and have incentives aligned.
This means there is a very low chance of bad actor block producers popping up on the network.
This does, however, mean NEO loses significant advantages that more public, Proof-of-work blockchains achieve with a more distributed blockchain and higher hash rate.
Networks like Bitcoin are able to offer censorship resistance and immutability of transactions, and less governance power between nodes with greater transparency of network activity.
With this in mind, granular fundamental data is limited with metrics like Hash rate, Difficulty, Days destroyed and individual Dapp usage, unavailable or irrelevant. However, data on on-chain transactions, transaction volume and active addresses can be gathered using NEO block explorers.
(onchain data used for the next section was collected from coinmetrics.io)

NEO’s historical daily onchain transaction volume is punctuated by a few sharp spikes during peak boom periods around the end of 2017 and in January 2018.
NEO’s peak transaction volumes were hit on January 14th when ~$4.3 billion worth of onchain transactions occurred over the NEO blockchain.
These numbers quickly fell away, however, as positive retail speculation faded away from crypto markets.
The NEO network is not designed as a store-of-value asset or as a tool for payments. It uses a decoupled token system, designed to add another layer to existing fault tolerance.
NEO is the ownership stake, while GAS is distributed to NEO holders who claim GAS by holding NEO in a supported wallet — the tokens will be issued at a 1:1 ratio for the next 20 years.
Bookkeepers are entitled to charge fees (GAS) for transactions/power smart contracts, but are incentivized to keep these low.
In this sense, NEOs irregular transaction volume may be explained by a surge in interest to participate in the network at the end of last year, followed by an increase in the usage of GAS to participate in the ecosystem.
Even if this was the case, then over time, there is still an observed decrease in NEO participants choosing to increase their stake to receive more GAS and run more transactions over the network, or possibly fewer new users being attracted to the network.

However, the transaction volume for GAS are similarly erratic and irregular, likely even more so. Between the the 22nd and 23rd of January 2018, the daily transaction volume of GAS rose by over a 1000%, growth that is clearly unsustainable and raises questions around market manipulation and the maturity of the NEO blockchain and its underlying assets.
NVT assessment
With the previous data in mind, NEO’s NVT signal , (network value/30 day moving average of transaction volume) indicates that at a number of points over the last two years, the NEO token may have been overvalued given its transaction activity.
The NVT signal operates in a similar way to the price-equity ratio in traditional Finance. It essentially gives a raw signal to indicate if a digital asset is over or undervalued, based on transaction activity.
Transaction activity is used, because networks like NEO are designed to be used and have information consistently flowing between nodes, thus the value and price of a blockchain token should ideally be reflective of the usage of the underlying blockchain.
Because of accusations that crypto asset price movements are purely driven by speculation, manipulation and marketing, the NVT signal provides a useful metric to assess the fair value of a blockchain. It can also be interpreted as a reflection of how the market perceives the value of on chain transactions
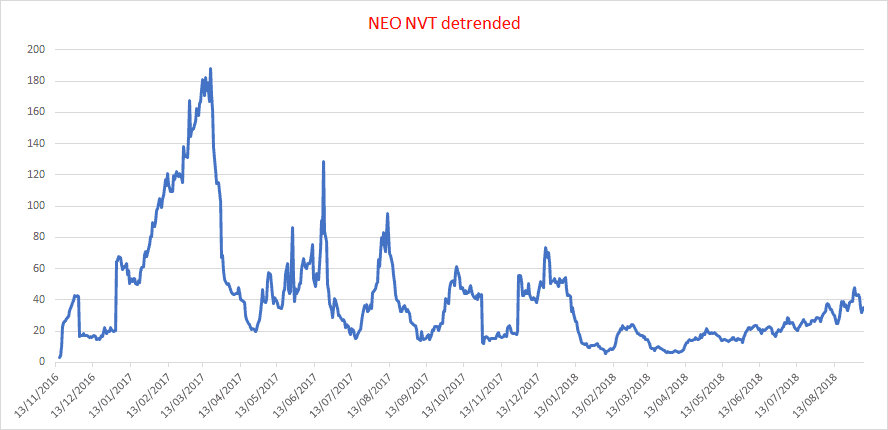
The above chart shows the NVT signal for NEO, smoothed using a 30 day moving average. Interestingly, NEO’s NVT signal was highest in Q1 2017, when the price of NEO hovered around $0.20 level but circulating token supply stood at a high 65 million.
This evidences that during this period, a large portion of the tokens in circulation were not being used for transactions and despite the low price, the size of the network and its valuation was a not a reflection of its usage, and was likely overvalued.
Interestingly, all time highs for the NVT do not occur when the price of NEO was most inflated, indicating that on chain transaction activity did move along with the price of the token. This implies that while some of the price boom at the end of 2017/start of 2018 was driven by pure speculation, there was an emergence of onchain activity that came with it.
A concerning trend in the data, is that NVT has risen over the last 90 days, while over the same time period, price has dropped as well (~70%), meaning on chain transaction volume has been falling at a faster rate than price (circulating supply is fixed at 65 million tokens).
This may be a sign that the downward price trend of NEO is leading to an increase of users leaving the network because of a lack of patience, or faith, that the network will ever deliver solutions.
Metcalfe assessment
Another useful tool to assess whether a network is valued fairly is Metcalfe’s law, which has maintained popularity since the 1980’s for establishing the true value of network based financial products.
In addition, researchers like Willy Woo, Dimitry Kalichkin and Clearblocks have studied the relationship of a blockchain networks active users (and the subsequent connections created), to the the price of their native tokens, with examples such as Bitcoin, Litecoin and Ethereum.

Theoretically, with platform based tokens like NEO, the more connections there are within the network, the greater its value because of the proposed network effects/economies of scale.
For example, for users participating within a NEO Dapp like Chainline, which offers peer-to-peer courier services, the Dapp becomes more valuable with more users because this creates spillover benefits like more geographically close delivery options. As NEO tokens are used for transactions within Dapps like Chainline, price should intuitively closely follow user growth.
For this reason the slide in NEO user activity observed, is concerning because individual NEO user experiences diminish the less activity there is on the network. In simple terms this means that joining the NEO network today (for non-speculative reasons), is significantly less appealing than it was nine months ago.
A factor in this drop off in users may be the overall bearishness surrounding crypto markets, and specifically related networks like Ethereum and Cardano. However, NEO has been criticized in the past because of technical issues surrounding the execution of smart contracts within the platform, and internal issues may have also contributed in the drop off in users.

The Price to Metcalfe ratio, is calculated by taking the natural log of network value divided the 30-day moving average of Metcalf law.

A high PMR indicates that price dominates Metcalfe, implying that some of the network value is driven by speculation and not based on fundamental network performance.
During early 2017, the large NEO circulating token supply skewed the data, and active addresses did not reflect the tokens market value, and for much of 2017, NEO was likely overvalued.
Similar as to what occurred with transaction volume, the falling PMR across the second half of 2017 indicates that, active addresses did grow as NEO’s price entered a bull period.
However, in recent months PMR has begun to rise steadily again. In the last six months (based on inhouse calculations) PMR has risen ~11.6%. This again indicates that NEO may be leaning towards overvalued, even though it is in the midst of a sharp price drop.
Technical analysis
Regression Channel and Long Term Trends
On the 1D chart, the death cross, using the 50 and 200 day EMAs, remains intact, and the 50 day EMA (red line) has settled around the resistance level of $24 (top dashed black line).

In 2018, the price of NEO has been contained within a negative linear price trend with a Pearson’s R Correlation between time and price of ~0.92 (regression channel). Price has ascended to near the top of the regression trend; currently sitting at ~$17.40. However, despite the price lift, the overall trend and 50 day EMA would suggest that $24 is strong price resistance.
Thus, a fall back towards the long term average is probable once reaching the $24 resistance level. Additionally, the volume flow indicator (VFI) has consistently remained beneath 0 since mid-May (black arrow), which visualizes the persistent lack of buying volume for NEO. The VFI interpretation is a value above 0 is bullish and below 0 is bearish, with divergences between price and oscillator being high probability signals.

Lastly, using fibonacci retracement on the "after tax season bottom" bounce, NEO topped out at ~$87 in mid-May. Furthermore, the current price resistance level of $24 is also the 0.236 fibonacci retracement level which further fortifies that resistance level to price (devoid of exceptional buying volume which the VFI shows has been lacking since May).

Ichimoku Clouds with Relative Strength Indicator (RSI)
The Ichimoku Cloud uses four metrics to determine if a trend exists; the current price in relation to the Cloud, the color of the Cloud (red for bearish, green for bullish), the Tenkan (T) and Kijun (K) cross, Lagging Span (Chikou), and Senkou Span (A & B).
The status of the current Cloud metrics on the 1D frame with singled settings (10/30/60/30) for quicker signals is bearish; price is below the Cloud, Cloud is bearish, the TK cross is bearish, and the Lagging Span is beneath the Cloud and touching price.
A traditional long entry would occur with a price break above the Cloud, known as a Kumo breakout, with price holding above the Cloud. From there, the trader would use either the Tenkan, Kijun, or Senkou A as their trailing stop.
NEO is currently sitting at ~$17.40 and is looking to attempt a Kumo breakout. The current RSI metric is almost 40 which indicates further price gains may lie ahead for NEO before reaching overbought territory. With that, price may acquire sufficient buying pressure to break Cloud resistance of $20 and enter the Cloud, but may not have volume to breach the critical $27 level.
On the downside, the support levels are $14 and $10 (critical to hold) with the long term level of $5. If price breaks above $27 and completes a successful Kumo breakout (unlikely), upside targets are $35 and $43.

The status of the current Cloud metrics on the 1D time frame with doubled settings (20/60/120/30) for more accurate signals is bearish; price is below the Cloud, Cloud is bearish, the TK cross is bearish, and the Lagging Span is beneath the Cloud and touching price.
The odds of a successful Kumo breakout are far smaller using slower settings with price needing to break and hold above $40 (flat Senkou B). The resulting upside price targets would be $55 and $61.

Conclusion
NEO’s poor price performance in recent times appears to be coinciding with a fall off in user activity and transaction volume, this is concerning and indicates that the token may continue to slide.
Correspondingly there are a great many Dapps and ICOs currently being devised and deployed for NEO, which is curious given the diminishing user activity and transaction volume, and raises questions around how many of them will achieve their potential.
An alternative explanation is that the NEO network in a consolidation period, and users will eventually return to the ecosystem as Dapps mature and bullishness returns to crypto markets.
The long term technicals for NEO are firmly bearish. However, price appears to be basing out around $17 with volatility compressing. The aforementioned, could result in a measured breakout to the upside (low probability). However, given the limited probability and power of the overall trend, that breakout bet (hypothetically from $17 to $27) is highly risky.

Both, the prudent short term trader (10/30/60/30) and longer term trader (20/60/120/30), on the 1D chart, will await a positive TK cross and Kumo breakout above $27 and $40, respectively, before entering a long position. Both trader’s support levels are $14 and $10 (critical to hold) with the long term level of $5.
In the unlikely event of a breakout, the (10/30/60/30) trader’s price targets are $35 and $43 and the (20/60/120/30) price targets are $55 and $61.
 Brave New Coin reaches 1M+ engaged crypto enthusiasts a month through our website, podcast, newsletters, and YouTube. Get your brand in front of key decision-makers and early adopters in 2026. Limited slots remaining! Find out more today!


