Pudgy Penguins (PENGU) Price Prediction: Can Bulls Break $0.011 Resistance and Trigger a Major Rally?

Pudgy Penguins (PENGU) is facing another important test as traders monitor whether buyers can regain control after a prolonged decline.
PENGU recently traded near $0.0073, with technical analysts identifying $0.011 as a critical resistance level that has repeatedly limited recovery attempts.
Despite occasional rebounds, PENGU remains under pressure across several timeframes. Traders are watching nearby support around $0.0070 and $0.0068, while a deeper historical support zone near $0.0055 could become important if selling resumes. The latest chart analysis suggests that a sustained move above resistance could improve the outlook, although current indicators do not yet confirm a broader bullish reversal.
PENGU Price Faces Key Resistance Near $0.011
Crypto trader @MstrTranquility recently highlighted PENGU’s daily chart, identifying approximately $0.011 as a persistent resistance zone. According to the analyst’s technical assessment, the token has faced repeated rejections around this level over several months.
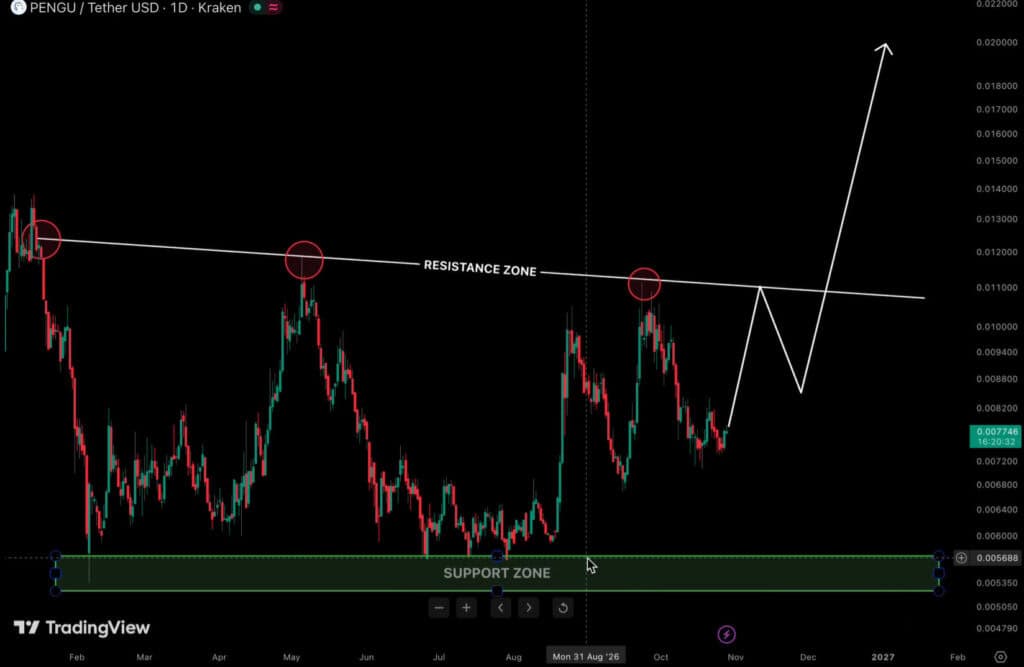
The chart highlights resistance near $0.011 and support around $0.0055, with a potential sharp rally if resistance is breached. Source: @MstrTranquility via X
The chart also identifies approximately $0.0055 as an important support area, where buyers have previously stepped in to defend the price. The distance between these two levels outlines a broad trading range that could determine PENGU’s next significant move.
A decisive breakout above $0.011 would indicate that buyers are overcoming a resistance zone that has repeatedly restricted upward momentum. However, a brief move above the level would not necessarily establish a lasting trend reversal. Sustained trading above resistance, supported by stronger volume, would provide more convincing evidence of improving demand.
Another trader, @alekstraderx, shared a 12-hour Bybit perpetual chart showing additional support and resistance confluence zones. The analysis places a nearby support area around $0.0068, with overhead resistance extending toward $0.0106.
These levels offer a more detailed view of PENGU’s shorter-term trading structure. The $0.0068 region is particularly relevant because it sits below the psychological $0.0070 threshold. A successful defense could help stabilize the token, while a sustained breakdown may expose it to additional selling pressure.
PENGU Technical Indicators Maintain a Bearish Bias
TradingView’s technical summary points to a difficult market structure for PENGU despite its occasional intraday recoveries. At the time of the supplied analysis, the token was trading around $0.00735, up approximately 0.88% over 24 hours.
However, the broader performance remained negative. PENGU had declined approximately 4.82% over seven days and 22.95% over the previous month. Its market capitalization stood near $464 million, reflecting the impact of the recent correction.
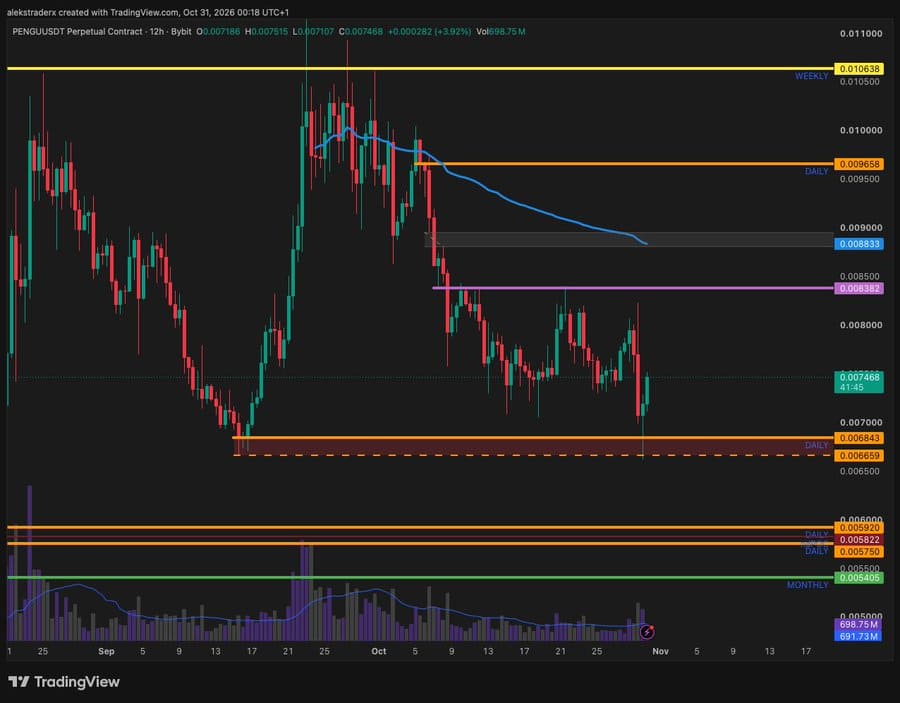
The 12-hour Bybit perpetual chart highlights key PENGU support near $0.0068 and resistance up to $0.0106 amid a prevailing downtrend. Source: @alekstraderx via X
Moving averages remain an important obstacle for a sustained recovery. Several short- and long-term simple moving averages (SMA) and exponential moving averages (EMA) were positioned above the spot price in the supplied technical assessment. This configuration suggests that previous support levels have turned into potential resistance zones.
The Relative Strength Index (RSI) also provides limited evidence of an immediate reversal. Rather than showing an extreme oversold reading that might indicate an exhausted sell-off, the indicator remains closer to neutral or weaker momentum territory.
TradingView’s broader technical assessment therefore favors caution. A modest daily recovery does not necessarily mean that the prevailing downtrend has ended. Buyers would need to reclaim important moving averages and establish higher price lows before the market structure could be considered more constructive.
$0.0083 and $0.0070 Define the Immediate PENGU Price Outlook
In the shorter term, approximately $0.00829 represents an important overhead resistance level in the supplied TradingView analysis. Reclaiming this area could help PENGU move away from its immediate bearish structure and bring higher resistance zones into focus.
A sustained move above $0.0083 would provide an early indication that buying pressure is improving. However, the token would still need to overcome the broader resistance around $0.0106 to $0.011 before a stronger bullish scenario could develop.
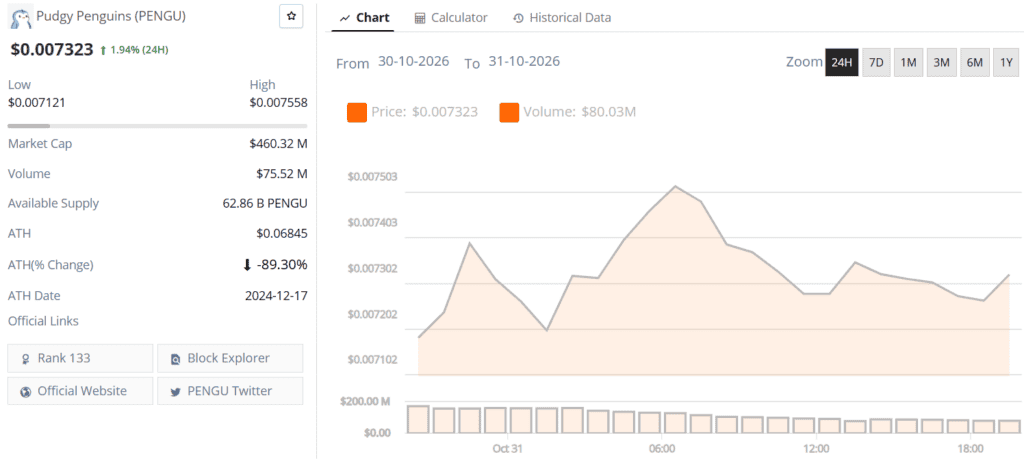
Pudgy Penguins (PENGU) price chart. Source: Brave New Coin
On the downside, $0.0070 represents an immediate psychological support level. Maintaining this area could allow the token to consolidate and attract buyers following its recent correction.
The nearby $0.0068 zone identified in the 12-hour Bybit chart provides another level to monitor. If PENGU loses both $0.0070 and $0.0068, selling pressure could increase as traders reassess the likelihood of a recovery.
A deeper support area near $0.0037 also appears in the TradingView assessment. This level represents a more distant downside reference rather than an immediate target. A move toward it would require a substantial deterioration in the current price structure.
Pudgy Penguins’ NFT Brand Provides Broader Market Context
PENGU is associated with the Pudgy Penguins ecosystem, which began as an Ethereum-based NFT collection of 8,888 individual penguin characters in 2021. The project subsequently expanded beyond digital collectibles into physical merchandise, including plush toys distributed through major retail channels.
This expansion has helped establish Pudgy Penguins as a consumer-facing Web3 brand rather than an NFT project focused exclusively on digital trading. Its physical products have also introduced the brand to audiences who may not actively participate in cryptocurrency markets.
The PENGU token has a maximum supply of approximately 88.89 billion tokens. Despite the brand’s broader commercial presence, the token remains exposed to cryptocurrency market volatility, speculative trading activity, and changing investor sentiment.
PENGU also trades substantially below its 2024 all-time high, which was approximately $0.068 according to the market data. Its current price near $0.0073 represents a significant decline from that historical peak.
The distinction between brand expansion and token performance remains important. Commercial visibility does not automatically translate into sustained demand for the associated cryptocurrency. Market participants will continue to assess token liquidity, trading activity, and broader market conditions when evaluating PENGU’s valuation.
Can PENGU Break $0.011 and Trigger a Major Rally?
The $0.011 resistance zone remains the central level in the bullish scenario for Pudgy Penguins. A successful breakout could signal a shift in market sentiment, particularly if it coincides with increasing trading volume and improving momentum indicators.
Before reaching that level, however, PENGU must overcome intermediate resistance around $0.0083 and the broader $0.0106 area. These price zones could attract sellers and limit recovery attempts. Buyers would need to establish sustained support above each threshold to strengthen the case for further upside.
The bearish scenario remains relevant if the token fails to hold its nearby support levels. A breakdown below $0.0068 could weaken the short-term structure, while a deeper decline toward $0.0055 would bring the historical support zone highlighted by @MstrTranquility back into focus.
For now, PENGU’s technical outlook remains cautious. Its expanding consumer brand offers a broader ecosystem narrative, but the price chart continues to reflect selling pressure. A confirmed breakout above $0.011, rather than an isolated upward move, would provide stronger evidence that bulls are regaining control.
 Brave New Coin reaches 1M+ engaged crypto enthusiasts a month through our website, podcast, newsletters, and YouTube. Get your brand in front of key decision-makers and early adopters in 2026. Limited slots remaining! Find out more today!