Quant (QNT) Price Prediction: Bulls Target $302.67 Retest After Reclaiming $200 Support

Quant (QNT) has regained the psychologically important $200 level, strengthening its technical position after a volatile October.
The recovery comes as Quant price breaks above a falling wedge resistance on the 8-hour chart, putting several higher price targets back in focus.
The latest technical analysis identifies $238.28, $253.48, $275.11, and $302.67 as potential upside levels if the breakout receives confirmation. However, QNT still faces resistance from the Ichimoku cloud, while mixed momentum indicators suggest that further consolidation remains possible before a sustained upward move.
QNT Reclaims $200 as Falling Wedge Breakout Draws Attention
QNT was trading around $200–$201 on November 1, recovering from recent fluctuations that pushed the token toward the $192 area. Its 24-hour trading range extended approximately from $192 to $208, reflecting continued activity around the reclaimed psychological level.
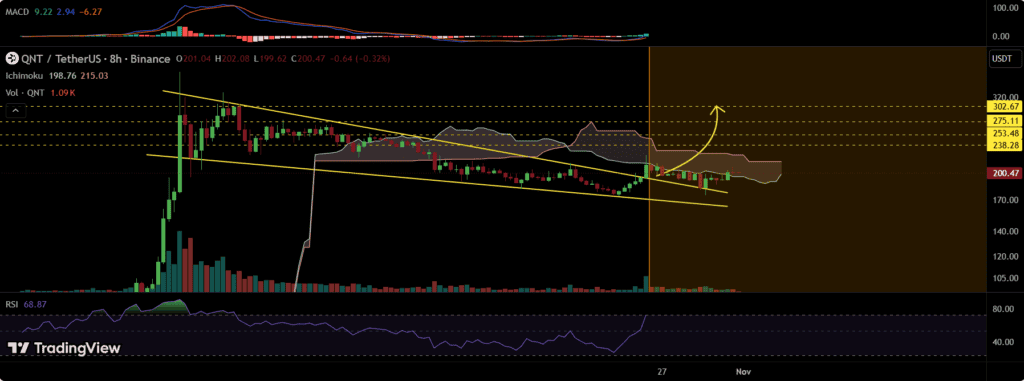
QNT has broken above the falling wedge resistance on the 8-hour chart with strong volume. Source: DigitalChartist on TradingView
The recovery follows a volatile October, during which QNT traded within a broader range of approximately $175–$223. Market capitalization estimates ranged from $2.3 billion to $2.9 billion, while daily trading volume stood between roughly $57 million and $64 million across different market snapshots.
A technical chart shared by DigitalChartist on TradingView shows QNT breaking above the descending resistance of a falling wedge on the 8-hour timeframe. The breakout was accompanied by stronger trading volume, suggesting increased buying participation during the recovery.
However, the price is now approaching the Ichimoku cloud, an indicator commonly used to assess trend direction, support, and resistance. The cloud could present an additional obstacle before QNT establishes a stronger upward trend.
DigitalChartist’s analysis also identifies a possible retest of the broken wedge resistance. Such a move would allow the market to test whether the former resistance area can become support. A successful retest followed by a decisive move above the Ichimoku cloud would provide stronger technical confirmation.
The analyst’s projected upside levels are $238.28, $253.48, $275.11, and $302.67. These are conditional chart targets rather than confirmed price levels, with each depending on the continuation of the breakout structure.
QNT Price Prediction: Moving Averages Support the Broader Uptrend
QNT’s daily chart presents a constructive longer-term picture, although short-term momentum remains less decisive. The token is trading above most of its tracked moving averages, indicating that the broader recovery structure remains intact.
The 10-day simple moving average (SMA) is near $193, while the 10-day exponential moving average (EMA) sits around $196–$197. The 20-day SMA and EMA are also clustered near $196–$197, creating an important short-term support area.
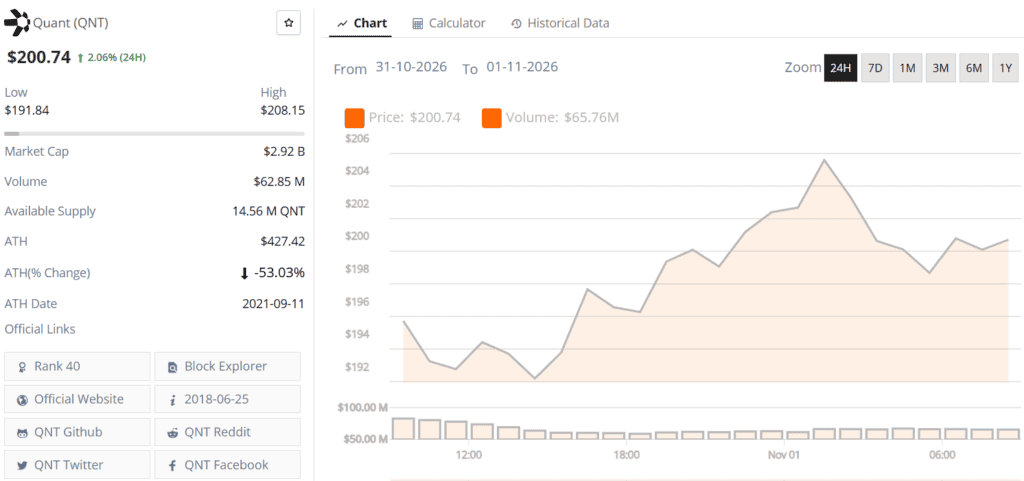
Quant (QNT) price chart. Source: Brave New Coin
Further below, the 50-day moving averages are positioned around $177–$180. The 100-day averages range from approximately $120 to $143, while the 200-day averages sit between $95 and $114. The distance between the current price and these longer-term averages reflects the strength of QNT’s preceding advance.
The positioning of the 50-day average above the 200-day average also supports the intermediate bullish structure. However, moving averages are lagging indicators and cannot independently confirm that the recent breakout will continue.
Momentum oscillators offer a more balanced assessment. The Relative Strength Index (RSI) on the daily timeframe is hovering around 49–53, placing it near the midpoint of its range. This suggests that buying pressure has not reached an overbought condition, but neither has momentum established a decisive bullish advantage.
The Moving Average Convergence Divergence (MACD) readings are also mixed. Recent snapshots show the MACD line fluctuating around its signal line, with a negative histogram in some readings. This indicates that the short-term recovery still needs stronger momentum confirmation.
Bollinger Bands provide additional context. The middle band is positioned around $196–$197, while the upper band ranges from approximately $212 to $219. The lower band sits near $175–$179. QNT’s return above the middle band is constructive, although a move toward the upper band would require sustained buying interest.
Key QNT Support and Resistance Levels to Watch
The $200 level remains the central technical reference for QNT. Holding above it could improve market sentiment and provide a foundation for another attempt at nearby resistance.
Immediate support is concentrated between $192 and $197. This zone combines recent trading lows with the short-term moving-average cluster. A sustained move below this area could weaken the recovery and expose lower support levels.
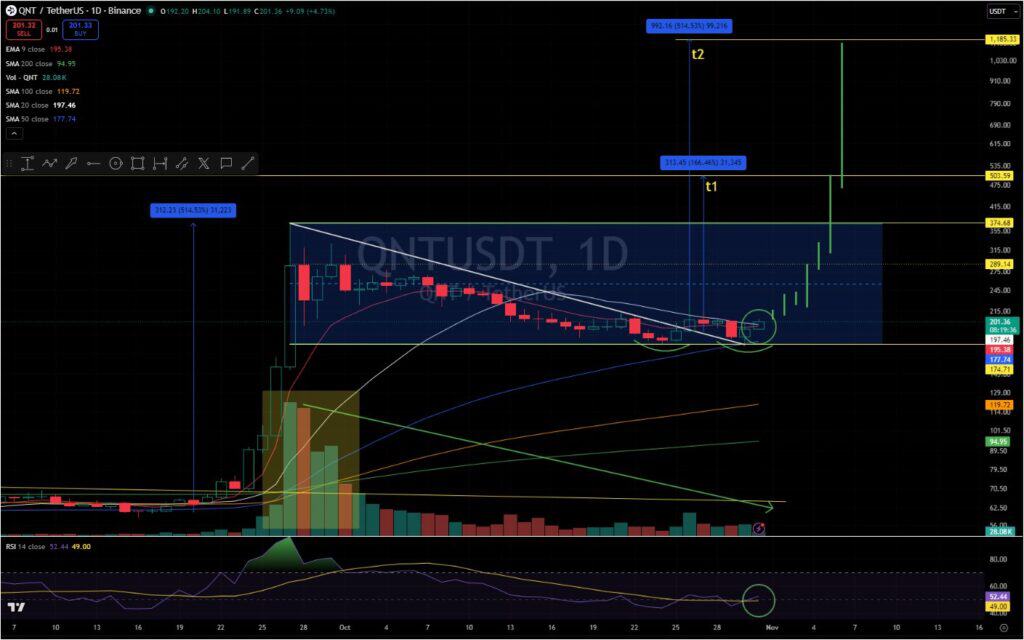
QNT shows bullish momentum after breaking its local downtrend, retesting bull flag support, forming a double bottom near $175, and bouncing off the daily 50-day SMA. Source: @DrewDog12380 via X
The next support region lies between $182 and $189, where the 50-day moving averages and other technical reference levels converge. Below that, the $171–$176 region represents another important demand area, particularly given its relationship with October’s price action.
On the upside, QNT faces initial resistance between $201 and $208. A daily close above this range would strengthen the case for a move toward the $211–$216 area.
The next resistance cluster sits around $223–$226, representing a potential hurdle before the higher targets identified on the 8-hour chart become relevant.
Classic pivot calculations also place immediate resistance near $202, followed by a second resistance level around $212–$213. These levels broadly align with the short-term resistance zones identified through moving averages and recent price action.
A sustained recovery above $216 would improve the technical outlook. It could then open the way toward $238.28, followed by $253.48 and $275.11. The final projected target at $302.67 would require a much stronger continuation of the current upward structure.
Traders Identify $203.85 as an Important Breakout Level
Other market participants are monitoring additional resistance levels that could influence QNT’s next move.
Crypto trader @Ekoanalizz highlighted $203.85 as a key resistance level on the daily chart. The analysis suggests that a decisive breakout could attract additional buying interest and improve the prospects for bullish positions.
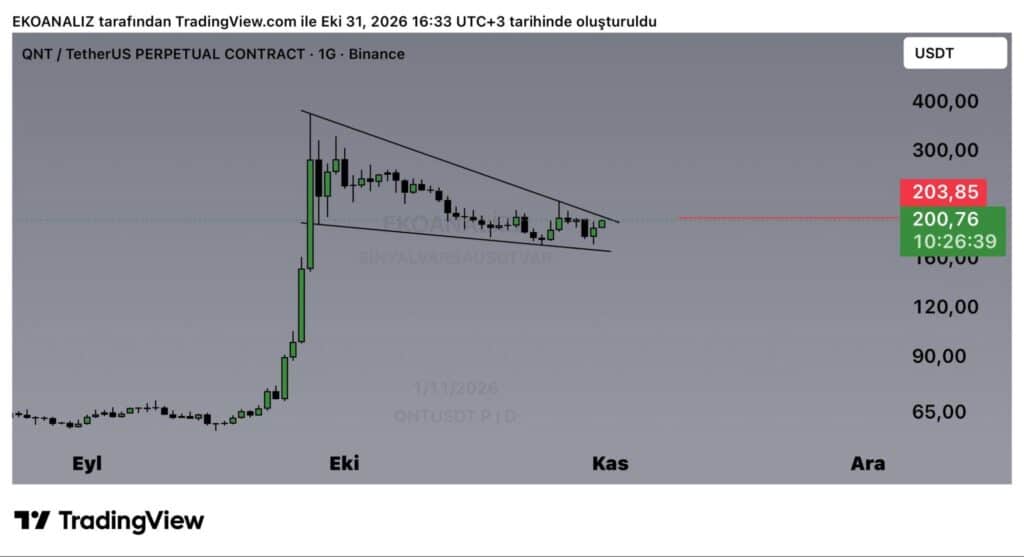
The daily QNT chart identifies $203.85 as key resistance, with a breakout potentially triggering a sharp rally and strengthening bullish momentum. Source: @Ekoanalizz via X
The level is particularly relevant because QNT has been consolidating near $200 beneath a descending trendline. The token’s October trading range, which extended roughly between $175 and $223, shows that buyers have yet to establish a sustained move above the broader resistance structure.
Another technical analysis shared by @DrewDog12380 identifies several bullish developments, including a break above a local downtrend, a potential bull flag retest, and a double-bottom formation near $175.
The chart also highlights a rebound from the daily 50-day simple moving average and a bullish RSI crossover. Declining volume during the pullback was identified as another potentially constructive signal, as it could indicate that selling pressure was easing.
That analysis marks upside projections near $312 and $992. However, these are considerably more aggressive than the $302.67 target identified in DigitalChartist’s 8-hour analysis. They should therefore be treated as separate technical scenarios rather than a unified market forecast.
The difference between these projections highlights the uncertainty surrounding QNT’s longer-term price trajectory. A breakout above immediate resistance would provide a clearer basis for evaluating higher targets.
Limited QNT Supply Adds Another Factor to the Market Outlook
Quant’s circulating supply is another factor frequently discussed by traders evaluating its price potential. Estimates cited in market commentary place the circulating supply at approximately 14.5 million QNT, although some traders refer to a figure closer to 12 million when discussing the token’s available float.
A relatively limited circulating supply can influence price movements when demand increases, particularly if available liquidity is thin. However, circulating supply alone does not guarantee a supply squeeze or higher prices. Exchange liquidity, trading volume, token distribution, and broader market conditions also influence price discovery.
At a market capitalization approaching $2.9 billion, QNT already represents a substantial crypto asset. Any sustained advance would therefore require sufficient capital inflows and continued demand rather than relying solely on its limited token supply.
The combination of a falling wedge breakout, a potential bull flag retest, and a recovery above the daily 50-day moving average has attracted bullish attention. Nevertheless, confirmation through price action and trading volume remains essential.
Looking Ahead: Can Quant Reach $302.67?
QNT’s recovery above $200 has improved its near-term technical structure, but the next resistance levels will determine whether the rebound develops into a sustained advance.
The immediate bullish scenario depends on the token maintaining support around $192–$197 and breaking above the $203.85 resistance highlighted by traders. A stronger move through $208 and the $211–$216 resistance cluster would provide additional confirmation.
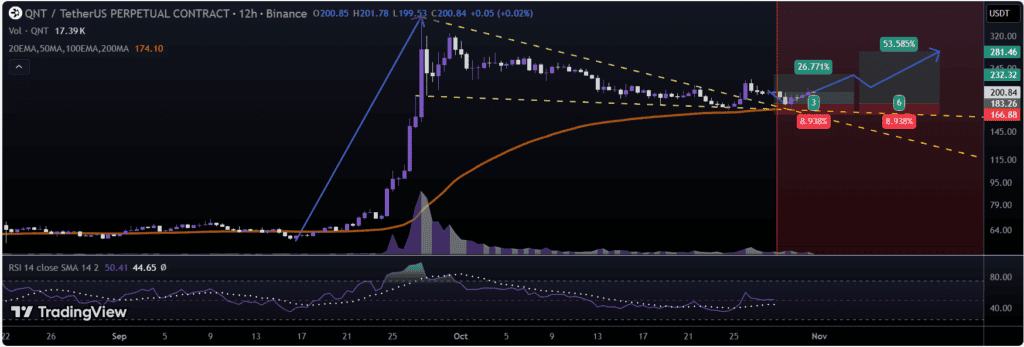
QNT is retracing toward 100 EMA support, where a rebound could support a resumption of its short-term bullish trend. Source: TradingView
If buying pressure continues and QNT moves above the Ichimoku cloud on the 8-hour chart, the projected targets at $238.28, $253.48, and $275.11 could become relevant. A sustained advance beyond these levels would bring the $302.67 target into focus.
On the other hand, rejection near $203.85 or failure to maintain the $192–$197 support zone could extend the consolidation. A deeper correction may expose the $182–$189 region, followed by support around $171–$176.
For now, the technical picture remains cautiously constructive. QNT’s position above its longer-term moving averages supports the broader uptrend, while neutral daily oscillators indicate that the market has not yet established decisive short-term momentum.
The $200 level, the $203.85 resistance, and the Ichimoku cloud are therefore important areas to monitor as traders assess whether Quant can extend its recovery toward $302.67.
 Brave New Coin reaches 1M+ engaged crypto enthusiasts a month through our website, podcast, newsletters, and YouTube. Get your brand in front of key decision-makers and early adopters in 2026. Limited slots remaining! Find out more today!