The Best Times To Buy Crypto: How do Markets Perform In June?

![]()
With summer here, and the end of strong first five months of the year - what are the prospects for a bullish June?
Seasonal effects are common in financial data sets. The prices of commodities change because of the shifts in temperature between the summer and winter months. The prices of stocks are affected by the annual earnings season and the Christmas holiday period.
The digital asset class is no different. While it’s true that there are only 12 years of data to draw from, even so, if someone asks ‘What are the best months to buy crypto’ there are a range of observations that can be made around what Bitcoin and the rest of the crypto markets are more likely to do during particular months or quarters of the year.
For example, digital assets still react to impending tax seasons and holidays like Chinese New Year. As we enter the summer of 2023, following a positive start to the year, Brave New Coin explores the historical price performance of Bitcoin and Ethereum in June to see if any emerging patterns can add information to crypto trading and investment strategies.
The Bitcoin Price in June
Source: https://www.bitcoinmonthlyreturn.com/ (Updated)
In terms of the best months for crypto gains, June has historically been one of BTC’s weakest months. Over the last 11 years, on average, the price of BTC has risen by a steady ~6.96% during the month. While this may satisfactory for investors, it is on average Bitcoin’s third weakest month. The asset has on average only performed worse in August and September.
The extended summer months, between May and October, have generally been a period of seasonal weakness. In trading, there is a saying “sell in May and go away”, it is based on stocks’ historical underperformance during this 6-month period. Overall, the best months for crypto historically, and for Bitcoin in particular, have been November and April.
There are some theories for why this pattern recurs. In the early days of modern financial markets in the 20th century, there was a direct tie to the agricultural production cycle. Today, the mid-April US income tax filing deadline is considered to be a more direct factor.
In June 2022, the crypto lending market crash that began with Terra, Luna and the Anchor protocol hit a zenith. The price of Bitcoin dropped below US$20,000 during this month and the decision by major centralized savings, borrowing & lending platform Celsius to completely halt withdrawals sent the market into a tailspin.
One year on, Digital asset investors will hope for a less chaotic June in 2023.
Bitcoin Monthly Returns
The average monthly return of Bitcoin between the beginning of June and the end of September since 2011 is ~2.7%. The average monthly return in the other eight months of the year is ~19.3%. In bearish years like 2018, 2021 and 2022 BTC primarily traded red through these months.
2023 has so far been a positive year for BTC. The first four months were all positive for the asset, with January and March being particularly strong. The BTC price slid in May, however.
Nonetheless, the Bitcoin price is up ~64.1% year-to-date. Its all-time high price of ~US$69,050 was hit on Nov 10, 2021, just over 18 months ago. The draw-down since Bitcoin reached that all-time high currently stands at ~60.8%. The asset currently trades for US$25,855.
While a 60.8% drawdown may turn participants from legacy financial markets as white as a sheet, large drawdowns of over 50% happen often in crypto markets in general – and regularly for Bitcoin.
Between June 2011 and November 2011, for example, the price of BTC dropped ~93%, falling from trading at ~US$32, to ~US$2 in under six months. Between November 2013 and January 2015, the price of BTC dropped ~88%. The asset went from trading for US$1,242 to trading for ~US$152 in just over a year. Between December 2017 and December 2018, the price of BTC dropped ~84%. From trading for ~US$19,900, over the course of a year, the asset dropped to trading for ~US$3,129. Between six chaotic days in April 2013, the price of BTC dropped 81%. From trading for US$266, the price of BTC dropped to US$50.
The current drawdown currently ranks as Bitcoin’s 5th steepest decline ever. It is not yet clear whether the price of BTC has bottomed. There may still be more bearish price action to come before we can determine exactly where the current price drop will stand amongst BTC’s other price collapses.
Bitcoin has so far recovered from its large drawdowns and in each of the mentioned price declines, BTC bulls have reclaimed the price they fell from. However, the time for each recovery was at least three times as long as the drawdown. The recovery to reclaim the original price from the two longer drawdowns mentioned, 2013 to 2015 and 2017 to 2018, took almost three years.
A difficult start to June 2023 for Digital Asset Markets
June 2023 has begun with a storm brewing over crypto markets.
It has been a volatile opening to the month for crypto with an aggressive United States Securities and Exchange Commission (SEC) pushing forward lawsuits against two of the largest exchanges and brands in the space, Binance, and Coinbase.
The two lawsuits are similar and allege that both entities operated as “unregistered securities exchanges within the United States”. According to the lawsuits, the business models of the exchanges operated without necessary securities compliance. While it has been hinted at that almost all digital assets were considered securities by the SEC, these businesses have been operating normally perhaps not expecting the financial watchdog to spring up suddenly snarling.
According to court filings, the SEC is charging Coinbase with operating as an unregistered broker, exchange, and clearing agency — thereby soliciting customers and handling orders for securities when it shouldn’t have been. The filing describes the following assets as securities — SOL, ADA, MATIC, FIL, SAND, AXS, CHZ, FLOW, ICP, NEAR, VGX, DASH, and NEXO. A major aspect of the lawsuit against both exchanges is their staking services for Proof-of-stake tokens which may be viewed as offering a passive income to investors.
“You simply can’t ignore the rules because you don’t like them or because you’d prefer different ones: the consequences for the investing public are far too great,” says Gurbir S. Grewal, Director of the SEC’s Division of Enforcement. “While Coinbase’s calculated decisions may have allowed it to earn billions, it’s done so at the expense of investors by depriving them of the protections to which they are entitled.”
Another consideration is that the case has been levied against Coinbase, Inc. and Coinbase Global, Inc. Not an individual executive working at Coinbase.
In Binance’s case, the sale of unregistered securities included two of its own assets — Binance coin (BNB) and Binance US-Dollar (BUSD). Binance Holdings Limited, BAM Trading Services Inc. (the parent company of Binance.US), BAM Management US Holdings Inc., and Changpeng Zhao (CZ) are all included in the lawsuit. The parent company, the operating company for Binance.US, and the CEO were all sued in this instance.
The lawsuit against Binance includes allegations that the exchange allowed for the co-mingling of customer funds, that an entity CZ-owned was inflating volumes on Binance.US, and that CZ was controlling Binance.US in the shadows when he was not meant to. It also alleges that Binance.com, allowed US customers to use the platform while publicly stating that this was not allowed.
“Through thirteen charges, we allege that Zhao and Binance entities engaged in an extensive web of deception, conflicts of interest, lack of disclosure, and calculated evasion of the law,” said SEC Chair Gary Gensler. “As alleged, Zhao and Binance misled investors about their risk controls and corrupted trading volumes while actively concealing who was operating the platform, the manipulative trading of its affiliated market maker, and even where and with whom investor funds and crypto assets were custodied.
On Tuesday, the SEC further asked a court to grant a temporary restraining order to freeze assets.
The price impact of the two lawsuits has been somewhat surprising. On the back of the Binance lawsuit becoming public, the price of BTC dropped by 5% immediately. The price of the asset dropped below US$26,000, a recent price resistance level, to around US$25,750. The lawsuit itself and the allegations that Binance was running an operation that risked customer funds contributed to the selling pressure that erupted on June 6th.
The next day despite the secondary Coinbase lawsuit, markets roared back to life and wiped out the losses from the day before. Bitcoin was soon back to trading above US$27,000
Source: Brave New Coin
It appears that bulls were happy to sweep up and buy BTC below US$26,000. It appears that an SEC endgame to push exchanges like Binance and Coinbase outside of the USA does not phase the market. The possibility of these lawsuits was likely priced in and regulators like the SEC have been aggressively targeting the digital asset sector. The SEC has filed over 100 lawsuits and pieces of litigation against the digital asset space in 2023.
In a quote shared with Brave New Coin, Stefan Rust, CEO of independent inflation data aggregator Truflation says the SEC’s decision to file charges against Binance and its founder Changpeng Zhao will likely lead to the exit of crypto’s biggest companies from the US. He also notes that other regulators appear open and ready to create rails for regulated, institutional-aligned digital asset service providers.
“US regulators, led by Gary Gensler at the SEC, appear to be out to unseat the largest companies in the cryptocurrency space. Gensler’s continued refusal to define digital assets – even in the face of demands from Congress and beyond – leaves companies like Binance and Coinbase vulnerable to enforcement action at any time.
Meanwhile, though, approvals continue to go through for established incumbents. Just yesterday, while SEC is suing Binance and other leading blockchain projects, the Commodity Futures Trading Commission approved an amended order of registration for CBOE Clear Digital, which will allow it to provide clearing services for digital asset futures.
It remains to be seen how crypto markets will absorb the regulatory cloud looming, but signs that it has been priced in will be encouraging to investors.
Everything else happening with the Bitcoin price this year:
2023 has been an excellent year for Bitcoin (BTC) bulls. In the first four months of the year, the BTC price has risen by 67.4%.
Performance this year contrasts starkly with 2022 which was a difficult year for BTC and the digital asset class in general. The collapses of Terra and FTX, alongside a slumping global economy that was struggling with inflation and reactionary interest rate hikes, were a recipe for a downward price trajectory and disillusioned investors.
This year the price of Bitcoin has surged, backed by its position as a banking crisis hedge. Other factors in the upward trend have also been the Bitcoin halving event being a year away and strong fundamental demand to use the network because of emerging utility.
The global macro economy has been dealing with the potential chaos of an impending global recession, the ongoing conflict between Russia and Ukraine, and rising fuel prices. Bitcoin however has been moving forward to the beat of its own drum.
Source: The Block Data dashboard
Bitcoin has an erratic relationship with other asset classes. The chart above indicates that sometimes BTC has a close positive correlation with equity markets and stock market indices like the S&P500 and Nasdaq Composite and at other times it moves alongside gold. Bitcoin sometimes moves like a risk asset and at other times it acts like a safe haven. Presently it is acting like a safe haven.
This tracking of gold occurred following news on May 1st that regulators took control of First Republic Bank. The regulators then sold a large chunk of its assets to JPMorgan Chase. First Republic is the largest US lender to fall since Washington Mutual in 2008. Bitcoin moved like safe haven, rising as an asset that may be unaffected by the chaos of the impending banking crisis.
Bitcoin has so far reacted positively to the 2023 banking crisis that has seen numerous major banks across the globe, collapse.
This year the price of Bitcoin has surged, backed by its position as a banking crisis hedge. Bitcoin (BTC) has boomed following the collapses of Silicon Valley Bank and Credit Suisse.
Bitcoin was built to be a decentralized payment network that removed intermediaries and counterparties from transactions. It has a purposefully built hard-coded, predictable monetary supply. The inherent narrative of bitcoin has resonated with investors— a pure asset uncontrolled by interest rate cycles and chaotic central bankers
When Satoshi Nakamoto first uploaded the Bitcoin Whitepaper in October 2008, financial markets were in turmoil and US government agencies were bailing out banks. Central Banks were printing money and creating lines of liquidity to prop up the financial system.
It is unclear whether this continued high beta, safe haven-style price activity will continue. While the asset sometimes behaves like gold and sometimes like a risk asset it is perhaps most likely an uncorrelated asset.
In a report for the Federal Reserve of New York, however, staffers Gianluca Benigno and Carlo Rosa argue that there is a disconnect between Bitcoin and macro. Their robust empirical analysis finds that BTC does not respond to macro news as one may expect. They write, “Bitcoin is an asset with no intrinsic value whose current value depends on the discounted value of its future price, so we should expect Bitcoin to respond to monetary policy news as it is reflected in changes in current and future real interest rate.”
They find that while other US asset prices respond to both the target and the path of monetary policy news, Bitcoin is unresponsive to unexpected changes in the short-term rate while its reaction to news about the future path of policy is not robust. In their conclusion, they do acknowledge that they are using a small dataset.
Bitcoin may be shifting and reacting to more sector-specific events such as digital asset regulation and the halving.
The bitcoin halving is pivotal in crypto markets because of the strong positive effect it has on the price of BTC. It occurs approximately every four years and cuts the supply rate of new Bitcoin in half. The halving reduces the rate of inflation and like clockwork, creates upward price pressure for Bitcoin.
At block height 840,000 expected to occur in April 2024, Bitcoin’s block reward, for successfully-mined blocks, will halve from 6.25 coins to only 3.125. This will continue at the same rate for another 210,000 blocks. Roughly another four years.
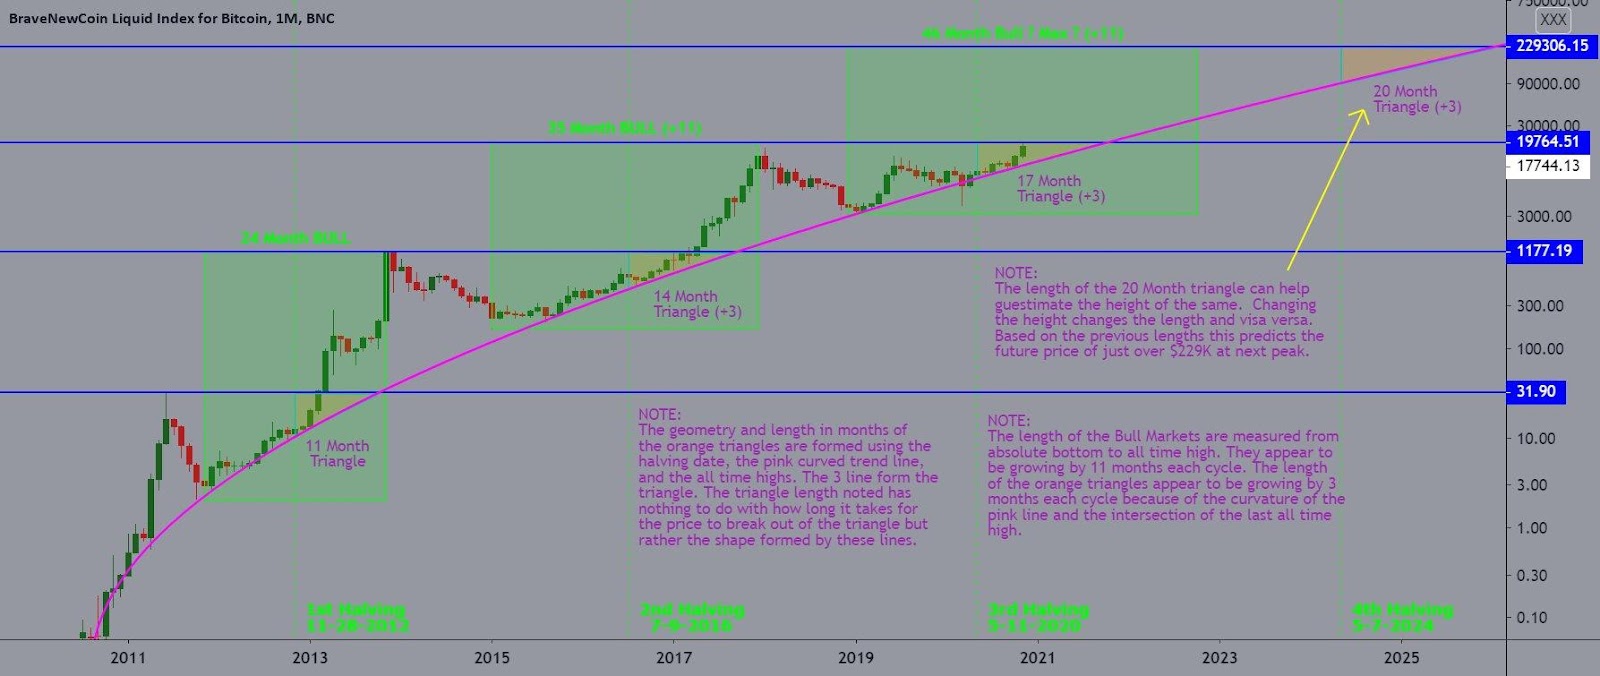
Bitcoin bulls generally tout the halving as a powerful bullish tailwind and often focus on investing around this four-year cycle. Generally leading up to halvings Bitcoin enjoys bullish momentum, as investors prepare for the supply shock. In simple supply and demand terms, if demand stays constant and supply receives a shock like a halving that makes the creation of new supply slower, the price should rise. Historically, this is how the price structure of BTC has played out.
With the halving now less than a year away (April 2024), Bitcoin bulls likely have one eye on their calendars in preparation for the event.
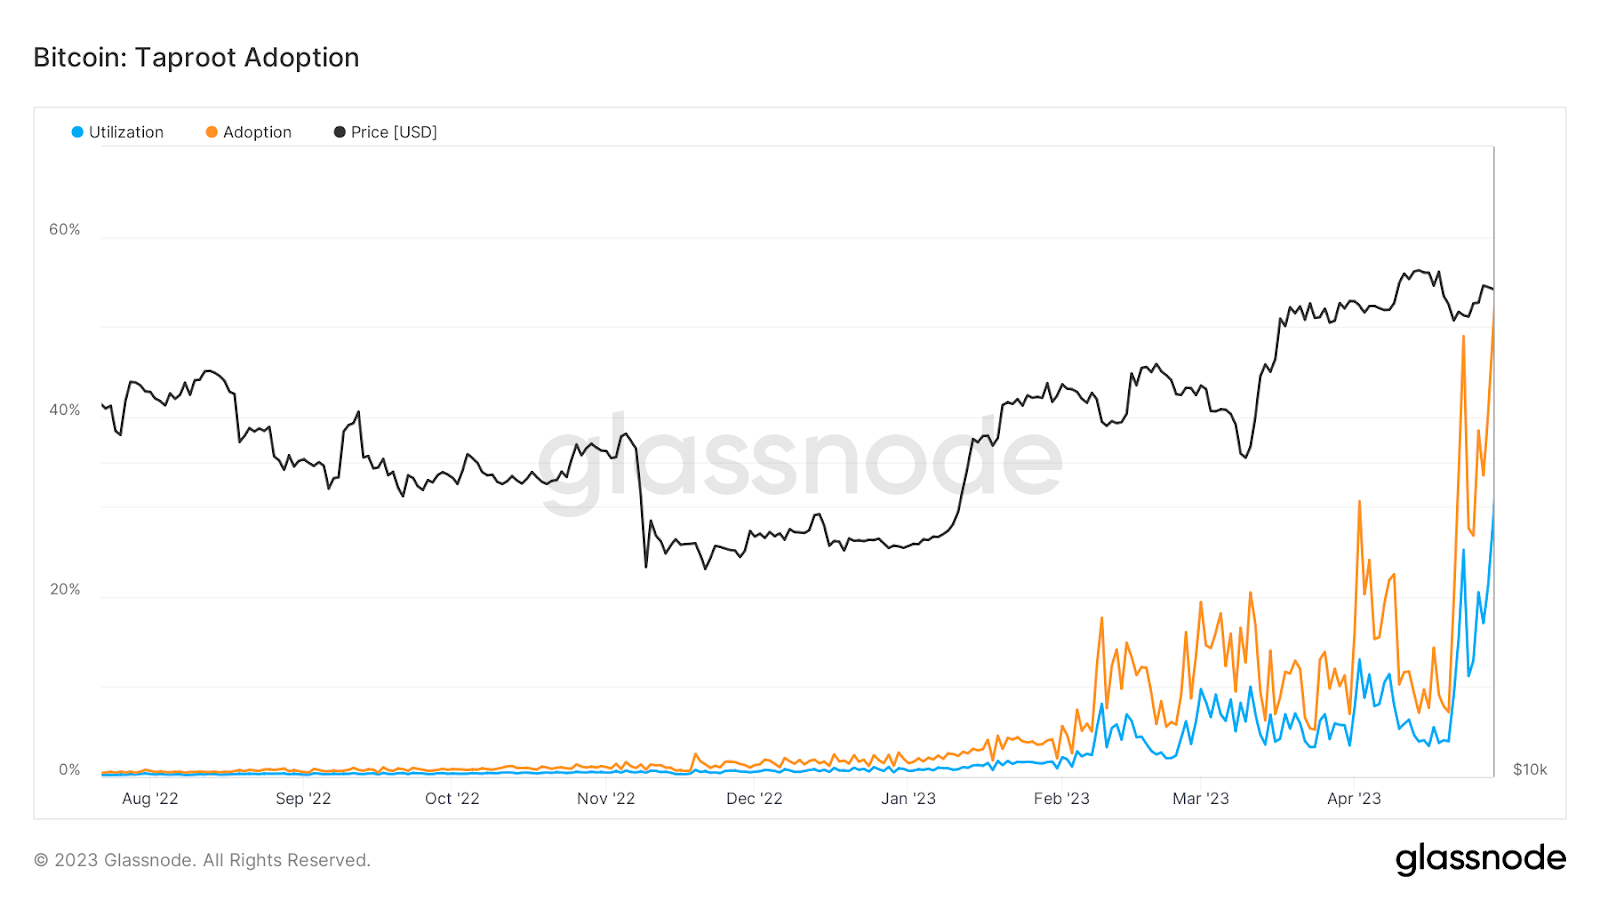
Bitcoin (BTC), is dealing with a controversial new feature that may be dividing community opinion but is leading to a surge in demand to use the blockchain. The Bitcoin Ordinals protocol introduced in 2023, has caused an increase in transactions on Bitcoin. Described by some as Bitcoin NFTs, Ordinals bring a new type of utility to the Bitcoin network that has immediately resonated with users.
Ordinals were enabled by November 2022’s Taproot upgrade. Taproot enabled the Ordinals protocols and has opened the door for fungible or non-fungible tokens to be issued directly on the Bitcoin network, uniquely identifiable by a number signature on the smallest unit of BTC, a satoshi.
There are a number of different use cases Ordinals can power. They have primarily been used to create non-fungible tokens (NFTs) but they are now gaining popularity as a way to issue fungible tokens. Ordinals power the BRC-20 standard which resembles Ethereum’s popular ERC-20 standard.
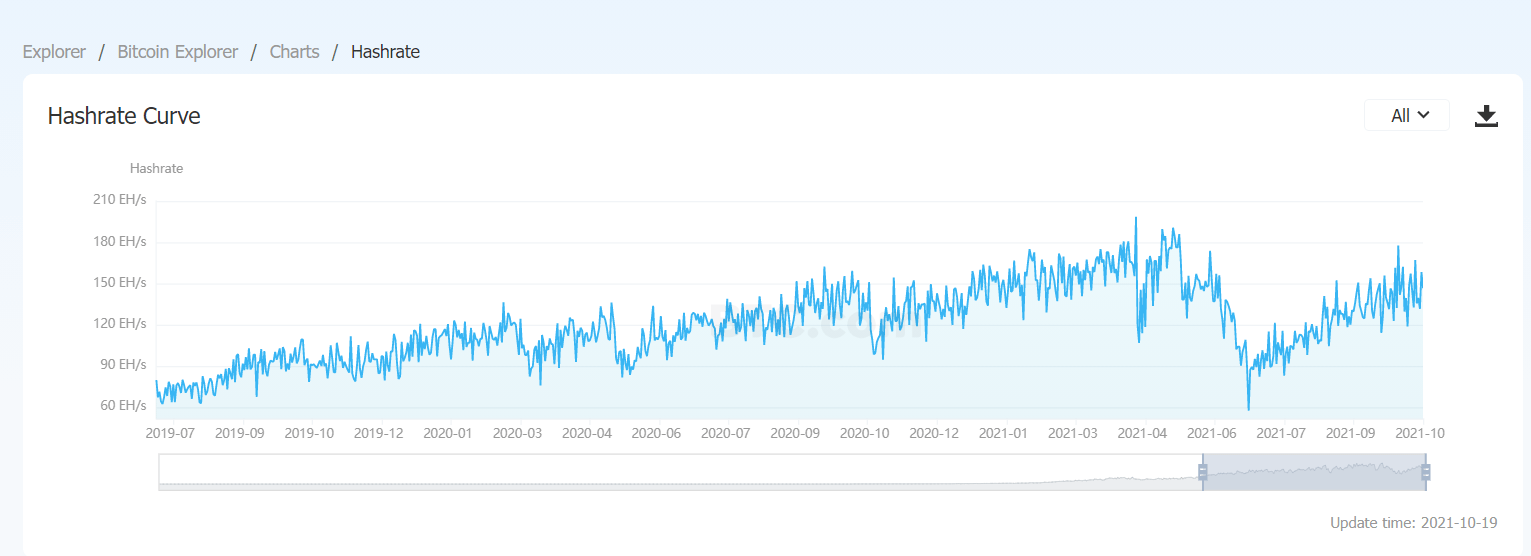
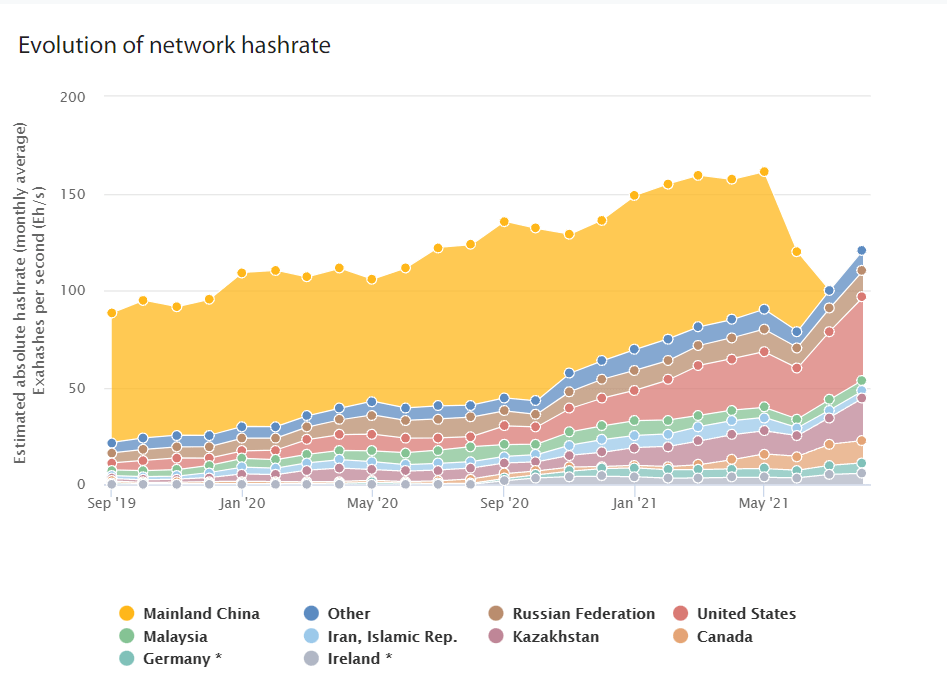
Across a number of key metrics (Transaction count, hashrate, BTC on exchanges, Address activity), it appears clear that the Bitcoin network is booming.
Bitcoin transaction count, Source: Glassnode
Bitcoin transaction count, source: Glassnode
BTC balance on exchanges (less BTC on exchanges means more BTC onchain or in cold storage, an indicator of reduced selling pressure), Source: Glassnode

BTC addresses with non-Zero balances, Source: Glassnode
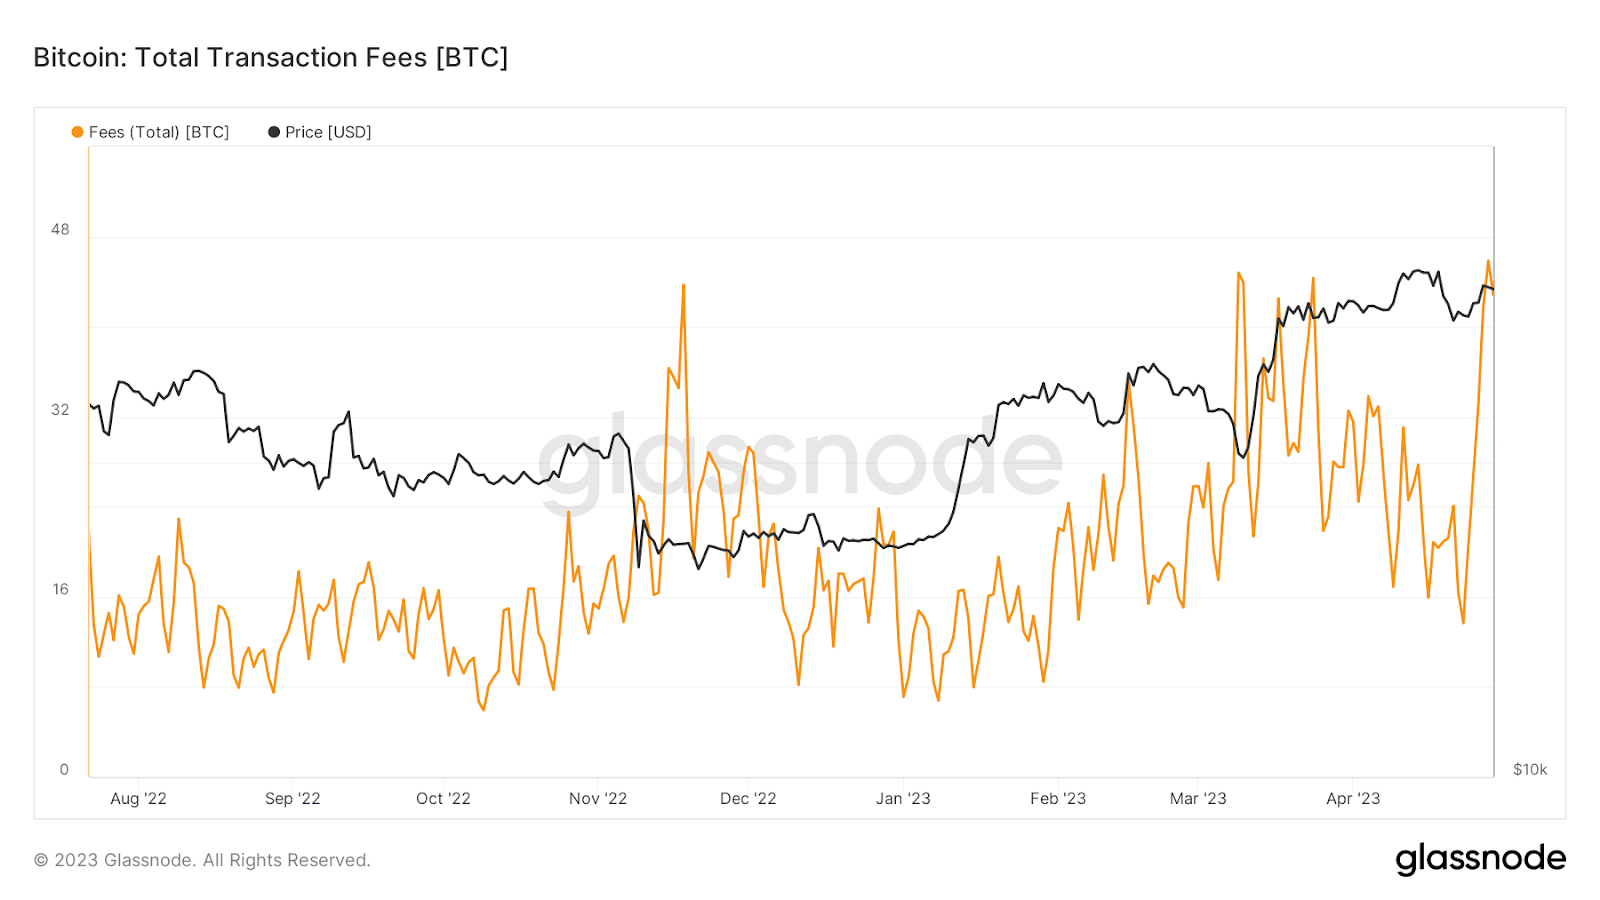
The emergence of Ordinals has had a clear impact on the wider Bitcoin protocol. While it has boosted transaction activity and increased demand to interact with Bitcoin, the protocol, however, has bloated the network and fees and wait times for transactions have become a pain point for users of the network. This has put pressure on layer-2 solutions like the Lightning Network to supplement and support the network.
Glassnode has recently reported that, for only the 5th time in history, the average fee per block exceeded the block subsidy. The last instance of this occurring was the 2017 market peak. In all five of the historical cases, high fees eased and the network normalized. Glassnode says that the fee boom was driven by the popularity of the BRC20 standard, enabled by the Ordinals protocol.
Transaction fees reached 6.66BTC, well above the 6.25BTC block reward. This made the total miner reward a staggering 12.9BTC per block or ~US$348,000.
You may have read the Bitcoin analysis for this year. Before continuing to the Ethereum analysis, you can take a break and check the latest price of Bitcoin and Ethereum on Novax. In addition to the latest prices, you can also read the latest news and even analysis about Bitcoin and Ethereum that are suitable for both traders and investors.
Ethereum price performance in June
Source: https://bitcoinmonthlyreturn.com/eth (updated)
“Sell in May and stay away,” needs to be slightly modified for Ethereum. For the digital asset market’s second-largest asset, “Sell in June and be back soon” is a more apt strategy. May has historically been Ethereum’s strongest month for average monthly returns, however, the asset still has a period of summer weakness with June and September being the asset’s two weakest months.
In June, the historical average return of Ether is -6.76%. In the months between June and the end of September, the average monthly return is 0.65%. The average monthly return for the other eight months of the year is ~14.43%.
Ethereum is up 53.8% year-to-date. The price of the 2nd largest asset has not been quite as aggressive as Bitcoin. This may be because it does not have the same safe haven characteristics as BTC. It has nevertheless performed well in 2023 and for many of the same reasons as BTC.
The asset has bounced back from the pits of 2022, when the collapses of Luna/Terra and FTX created concerns about the future of Web3 and decentralized. The market has realigned and there is an acceptance that the Web3 paradigm has immense potential despite the market crash. Web3 is a new version of the internet, powered by smart contract led by Ethereum, that allows users to gain back control of their personal data and not have to give it up to centralized entities like Google, Amazon, or Meta.
Buying pressure has been fueled by optimism for the future. While Web3 has perhaps lost some of its sheen as a disruptive technology to watch out for because of the renewed interest in Artificial intelligence and Augmented Reality based solutions, it remains one of the most relevant and well-backed emerging technologies.
Source:Coinmetrics
The 30-day Pearson correlation coefficient between BTC and ETH prices currently sits at 0.81. While this value is down from numbers as high as 0.95 observed in January 2023, it is still as a rule of thumb, a high value.
In April of this year, the Ethereum network underwent Shanghai, its first major upgrade since the Merge and the full launch of Ethereum 2.0 in 2022.
The ETH Shanghai upgrade via Ethereum Improvement Proposal-4895 enables the withdrawal of staking rewards that were earned by participating in Ethereum Proof-of-Stake Consensus. Users will also be able to exit staking entirely and unlock their full validator balance. Alongside Shanghai there was an upgrade to the Ethereum consensus client upgrade— Capella.
Post-Merge Ethereum operates as a single blockchain with two layers. The execution layer is where Ethereum transactions are processed and then broadcast to the rest of the network. The consensus layer manages transaction settlement and finality via the proof-of-stake consensus model.
Ethereum staking refers to participation in Ethereum’s transaction validation. Users lock-in, or ‘stake’ their ETH tokens on the blockchain in order to earn transaction validation opportunities that secure the network in exchange for rewards.
The key outcome of Shapella will be to allow the ETH validators who manage proof-of-stake consensus to shift their balances, currently locked on the consensus layer, to an execution layer address. This is simply an address that any everyday user of the Ethereum network is familiar with. This means validators will finally be able to unstake their ETH and staking rewards.
There were some concerns that the large unlock of staked Ether would lead to a wave of selling pressure as stakers can finally regain liquidity, but some observers say the unlocked ETH liquidity will be swept up by new demand to stake. There is also a view that ETH staking will increase post-Shanghai, given the new flexibility offered to stakers.
The Shanghai hard fork did not have a strong impact on price.
The price of ETH, surprisingly, soared after the Shanghai upgrade. This was despite a large level of unlocks around this period, On the 15th of April, US$740 million worth of ETH was unstaked from the Proof-of-Stake, despite the price of Ether actually rose. The withdrawals have been more than made up by deposits in the months since.
Conclusion
Heading into one of its historically most middling months, Bitcoin remains volatile but has shown signs that it is increasingly resilient nature. This year it has recovered from a cataclysmic exchange collapse that wrecked markets last year, shown appeal during a banking crisis that dragged down equity markets, and at least price-wise, shaken off a potentially bearish regulatory cloud.
The mantra of ‘sell in May and go away’ may likely ring with many investors. May and so far June, have been BTC’s only red months in 2023. This indicates that an intuitive seasonality argument may still ring true. There are signs, however, that Bitcoin is a more resilient asset with committed hands willing to accumulate and hold the asset. With the Bitcoin halving less than a year away, this may be the June to perhaps not to sell and go away.
 Brave New Coin reaches 1M+ engaged crypto enthusiasts a month through our website, podcast, newsletters, and YouTube. Get your brand in front of key decision-makers and early adopters in 2026. Limited slots remaining! Find out more today!


