Ripple Price Analysis – Large move on the horizon
Ripple (XRP) is currently the number three cryptocurrency by market capitalization, largely due to its total supply of ~100 billion XRP. The cryptocurrency is sold and managed by a company of the same name, Ripple, founded in 2012 by Chris Larsen and Jed McCaleb.
Ripple (XRP) is currently the number three cryptocurrency by market capitalization, largely due to its total supply of ~100 billion XRP. The cryptocurrency is sold and managed by a company of the same name, Ripple, founded in 2012 by Chris Larsen and Jed McCaleb.
 While Bitcoin is a decentralized digital currency, Ripple is a decentralized transaction network that also contains a digital currency called ripples or XRP. The network is seen by many as a Society for Worldwide Interbank Financial Telecommunications (SWIFT) analog, or potential SWIFT killer, with its on cross-border payment facilitation.
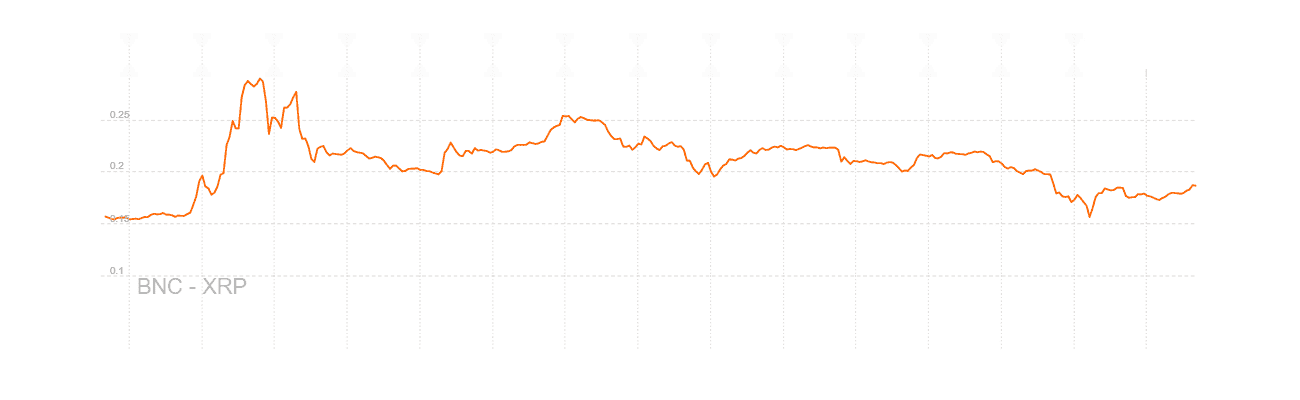
XRP seemed to have dropped off the trading radar until large spikes in value during April and May 2017, when announcements stating that banks had begun experimenting with the Ripple protocol for commercial purposes arose, and the majority of Ripples XRP holdings would be put in escrow. XRP was heavily bought, and soon after heavily sold, which indicates heavy speculative trading.

Ripple’s Consensus Ledger is said to be able to process up to 1,000 transactions per second and settle international payments in three seconds. More than 90 banks have now joined the Ripple blockchain network, and the company continues to make moves across Asia and India in an attempt to increase awareness and adoption.
If Ripple (the company) went away tomorrow, the XRP ledger would continue to exist and trade. However, Ripple controls ~65% of the total supply of XRP. Concerns in the market about uncertainty surrounding the company’s ongoing XRP distribution prompted CEO Brad Garlinghouse to announce that the company would place 55b XRP into escrow by the end of the year. The funds are locked in 55 separate 1b contracts, which expire on consecutive months dates. Each contract expires on the first day of a month, giving Ripple access to one contract every month to spend as they see fit.
Whatever is unused at the end of each month to the back of the escrow queue. For example, if 500M XRP remain unspent at the end of the first month, those 500M XRP will be placed into a new escrow account set to expire in month 55. For comparison, Ripple has sold on average 300M XRP per month for the past 18 months.
This centralisation of financial control can be see in the volume of XRP trading. While the cryptocurrencies market cap makes it the third largest digital asset, trading volume over the past 30 days puts them seventh, behind the likes of industry leaders Bitcoin, Ethereum, and their respective forks, Bitcoin Cash and Ethereum Classic.
 Most of the exchange traded volume originates from the XRP/KRW pair, on the exchange bithumb. The XRP/BTC volume is shared amongst HitBTC, Poloniex, and Bittrex.
 Earlier this month a fellow distributed ledger technology company, R3, announced it was suing Ripple for attempting to breach an XRP purchasing contract. Ripple immediately announced it was counter suing R3 for being unable to deliver promises made. Regardless of the outcome, both companies made headlines.
Ripple is no stranger to legal disputes regarding distribution. In early 2016, Ripple settled with co-founder Jed McCaleb regarding his Ripple equity post-exit in 2013. McCaleb was also responsible for forking Ripple and creating Stellar, a network for multi-currency blockchain-based trades, which went live in November 2015. McCaleb has made a comparison between Stellar and the Lightning Network.
Ripple also announced a conference slated for mid-October 2017 in Toronto, Swell, which will likely bring more buzz and awareness to XRP. The event is currently invitation only and will include former FED chair Ben Bernanke and inventor of the World Wide Web Tim Berners-Lee as speakers.
Technical Analysis
After a strong pullback from highs, as XRP has experienced, it’s important to decide whether there is an active bear trend or whether a trend reversal may happen soon. For this simple purpose, moving averages capturing a large quantity of data, usually the daily time frame, suffice.
 Price is currently under the daily 200EMA which makes the trend decidedly bearish, especially with a bearish 50/200 death cross in August. There was also a failed attempt to break the 200EMA in August.
The four hour time frame also shows the extent of the down trend. A bullish 50/200EMA cross would indicate a long entry opportunity.
 Using fibonacci retracements, measuring from the all time high to the most recent low, we can also get a roadmap for potential reversal zones or levels of resistance. The 50% retracement zone, ~14k Satoshis (Sats), is considered a high probability target once a trend reversal is confirmed complete.
 We can also use the Ichimoku Cloud, a constant, auto-drawn indicator that quickly offers an immense amount of valuable information on any time frame. The Cloud is best used at higher time frames as more data generally provides more accurate signals and less false positives.
The indicator uses a moving average and dynamic support and resistance to make key zone projections. Its goal is to capture 80% of any given trend. While it may seem complicated when viewed on the price chart, it is really a straightforward indicator that is very usable.
As long as the price remains above the Cloud, sentiment remains bullish. Price in the Cloud indicates a neutral trend, and below the Cloud indicates a bearish trend.
The best entry signals for the Cloud occur when the trend is obvious, but 1 or 2 signals have yet to become confluent with a higher time frame trend:
When the Tenkan (T) is over the Kijun (K) sentiment is bullish. K over T would indicate bearish sentiment. When the Lagging Span (LS) is above the Cloud and above the price sentiment is bullish, below the Cloud and below price would indicate bearish sentiment.
Additionally, in any given trend, price will continually attempt mean reversion to determine support levels. These pullbacks or corrections can be seen through touches of the Kijun, also known as the Kijun bounce.
 Only the daily time frame, you can see repeated Tenkan (blue) bounces signifying strong downtrend. In August, there was also a bearish Kijun bounce occurring during the failed 200EMA breach. Currently, the TK cross remains bearish. A long entry signal for an edge to edge trade would occur when a daily candle closes within the cloud. This usually occurs after a bullish TK cross, but not always. The target for the edge to edge trade is the opposite edge of the cloud, anywhere from ~12-14k Sats.
Alt coin prices generally move quicker than Bitcoin, and faster moving charts often require faster signals to keep up with on higher timeframes. Trading signals should always be as fast as they can be, without too much noise or too many false positives.
Using faster Ichimoku Cloud settings on the daily chart, 10/30/60/30, price is flirting with a cloud entry. Singled Cloud settings on the daily time frame have been back tested on more than 50 alt coins. The data shows superior and improved entries for Kumo Breakouts and TK Crosses when compared to the double 20/60/120/30 settings (data not shown).
Traders would typically avoid this cloud for edge to edge signals, and use signaled settings for traditional cloud signals. A Kumo Breakout with a bullish TK cross and bullish Cloud would be a strong long entry signal, especially considering the duration of this pullback and downtrend.
 On the four hour time frame, Cloud signals are neutral to bearish but are slowly beginning to flip bullish. A Kumo Breakout with bullish TK cross and Cloud on this time frame would trigger a long entry signal, albeit more aggressive than waiting for signals on the daily singled or doubled cloud.
 Lastly, Bollinger Bands are a measure of volatility traders will use to decide when a large post-consolidation move will happen. Bands often signal when to pay attention to the chart, but do not necessarily signal the direction. The Bands represent one standard deviation above and below the average price over the selected period, with the default being 20. A squeeze in the Bands represents price compression or lack of volatility.
 There is currently a tight Band squeeze similar to April 2017 which indicates that price may be ready to experience an explosive move. A break of Bands with volume, in either direction, usually signals the beginning of the interim trend, as seen in March and April.
Conclusion
Ripple has aligned itself with the banking and payment settlement industry. Any further announcements showing legitimate real world use cases for this purpose will be bullish for price, especially in Asia when exchange traded volume is highest. Several technical indicators are showing a calm in volatility with a large move on the horizon. The obvious immediate target for a bullish breakout would be between ~12-14k Sats.
 Planning your 2024 crypto-media spend? Brave New Coin’s combined website, podcast, newsletters and YouTube channel deliver over 500,000 brand impressions a month to engaged crypto fans worldwide.
Don’t miss out – Find out more today


