Bitcoin Price Analysis – Eye of the storm
We are in the eye of the storm as price moves sideways at these highes. We should see a move in either direction in the coming days. We are currently leaning toward the bullish side as we see price consolidate above support. Fundamentally, things looks great for Bitcoin as the Yuan approaches $7.00USD.
The technical setups posted below use simple trend detection, support and resistance, channels, pattern and candlestick analysis. We aim for high-probability trade setups on BTCUSD and use very few indicators. All charts use BNC’s Bitcoin Liquid Index for maximum accuracy.
The timeframe for trades is 1 to 7 days, so we’ll use 4h candlesticks. Bitcoin is best traded as a purely speculative commodity on 4h+ timeframes.
Market Sentiment And Macro Key Points
-
Overstock has begun trading its shares over the Bitcoin Blockchain, becoming the first publicly traded company to issue stock over the internet.
-
Indian and Venezuelan governments recently decided to ban large denomination notes and work to phase out cash. Also, reports show that Australia may join the trend and is considering getting rid of the $100AUD note as well.
-
The China bond bubble may be on the verge of popping. Today, the Chinese bond futures market suffered a record crash, plunging from 102 to nearly 94. Offshore Yuan has also increased significantly after the Fed raised rates, rising from 6.9 to approximately 6.95 overnight.
Long Term Technical Analysis
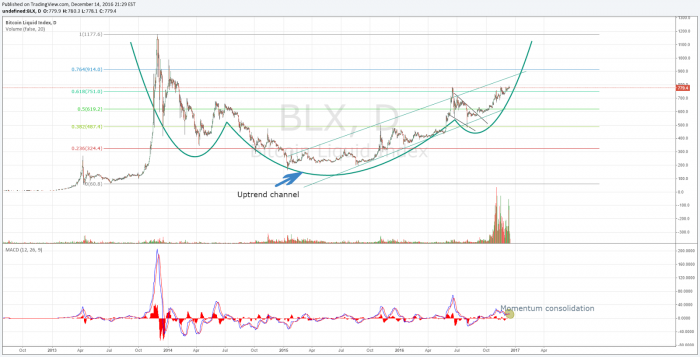
The long term uptrend remains intact, and the spot price seems to be holding well above the .618 fibonacci level. However, Bitcoin has made three attempts to break and hold above this year’s highs from June, which may be a sign of some exhaustion.
It’s worth noting that the price has had many opportunities to retrace back to long term support in the $600.00’s but continues to hold. This is likely to mean that there is still more strength left to go higher. Meanwhile, MACD shows that momentum has stagnated and is flat.
Trade Idea
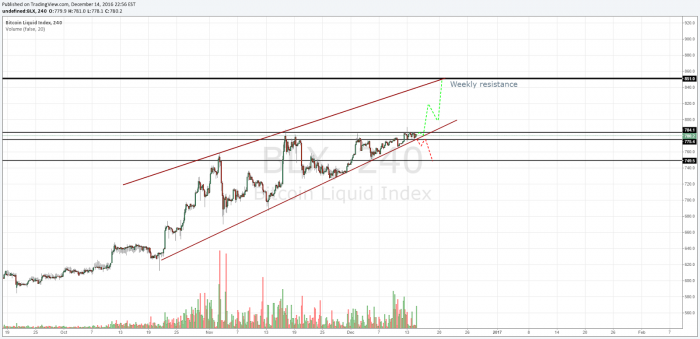
The spot price looks to be at the lower part of a large ascending wedge, and is currently sandwiched between weekly support and short term resistance. We are expecting a test of the next weekly pivot (resistance) of $850.00, should we breakout to the upside. If Bitcoin fails to muster up enough momentum, price should retrace to support at $750.00. While the spot price is currently at $780.00, we are currently in the lower part of the range of ($750.00 – $850.00) so, going long at these levels may present a better risk reward ratio.
Conclusion
We are in the eye of the storm as price moves sideways at these highes. We should see a move in either direction in the coming days. We are currently leaning toward the bullish side as we see price consolidate above support. Fundamentally, things looks great for Bitcoin as the Yuan approaches $7.00USD.
Disclaimer: The information presented in this article is general information only. Information provided on, and available from, this website does not constitute any investment recommendation.
Nathaniel Freire is a full time day trader trading Digital Assets, Forex and Stocks. Based in New Jersey, Nathaniel Freire specializes in technical analysis with a twist of social sentiment and fundamental analysis. You can follow Nathaniel on Twitter @Cryptocoinrun

Don’t miss out – Find out more today


