Nathaniel Freire
More from this author

We have finally broken out of a multi month consolidation pattern which is very exciting to see. Trading these breakouts can be very profitable and very risky. Look to longer term support and resistance levels to find price targets.

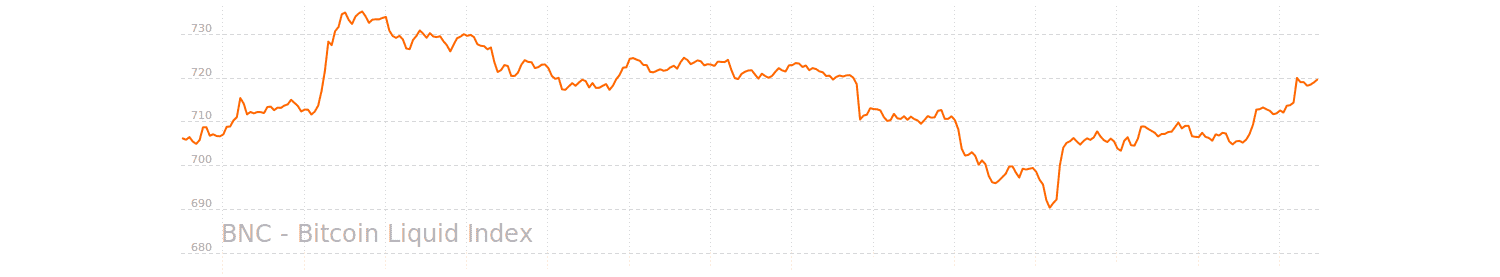
We are in the eye of the storm as price moves sideways at these highes. We should see a move in either direction in the coming days. We are currently leaning toward the bullish side as we see price consolidate above support. Fundamentally, things looks great for Bitcoin as the Yuan approaches $7.00USD.

Price has remained in the long term uptrend and we remain bullish. There may be a pullback in the short term, to $750, before heading back up to new highs, above $850.00. Momentum has been in consolidation and should break out soon.

The larger bitcoin trend remains a bullish week, having touched $750 before closing at $745. The spot price is well within the uptrend channel, the MACD momentum oscillator has printed a bullish divergence pattern, and a cup and handle pattern appears to be forming.

Bitcoin continues its long term uptrend. The price has reached the previous June highs of about $780.00, although there is a MACD bearish divergence on the daily chart.
The technical setups posted below use simple trend detection, support and resistance, channels, pattern and candlestick analysis. We aim for high-probability trade setups on BTCUSD and use very few indicators. All charts use BNC’s Bitcoin Liquid Index for maximum accuracy.

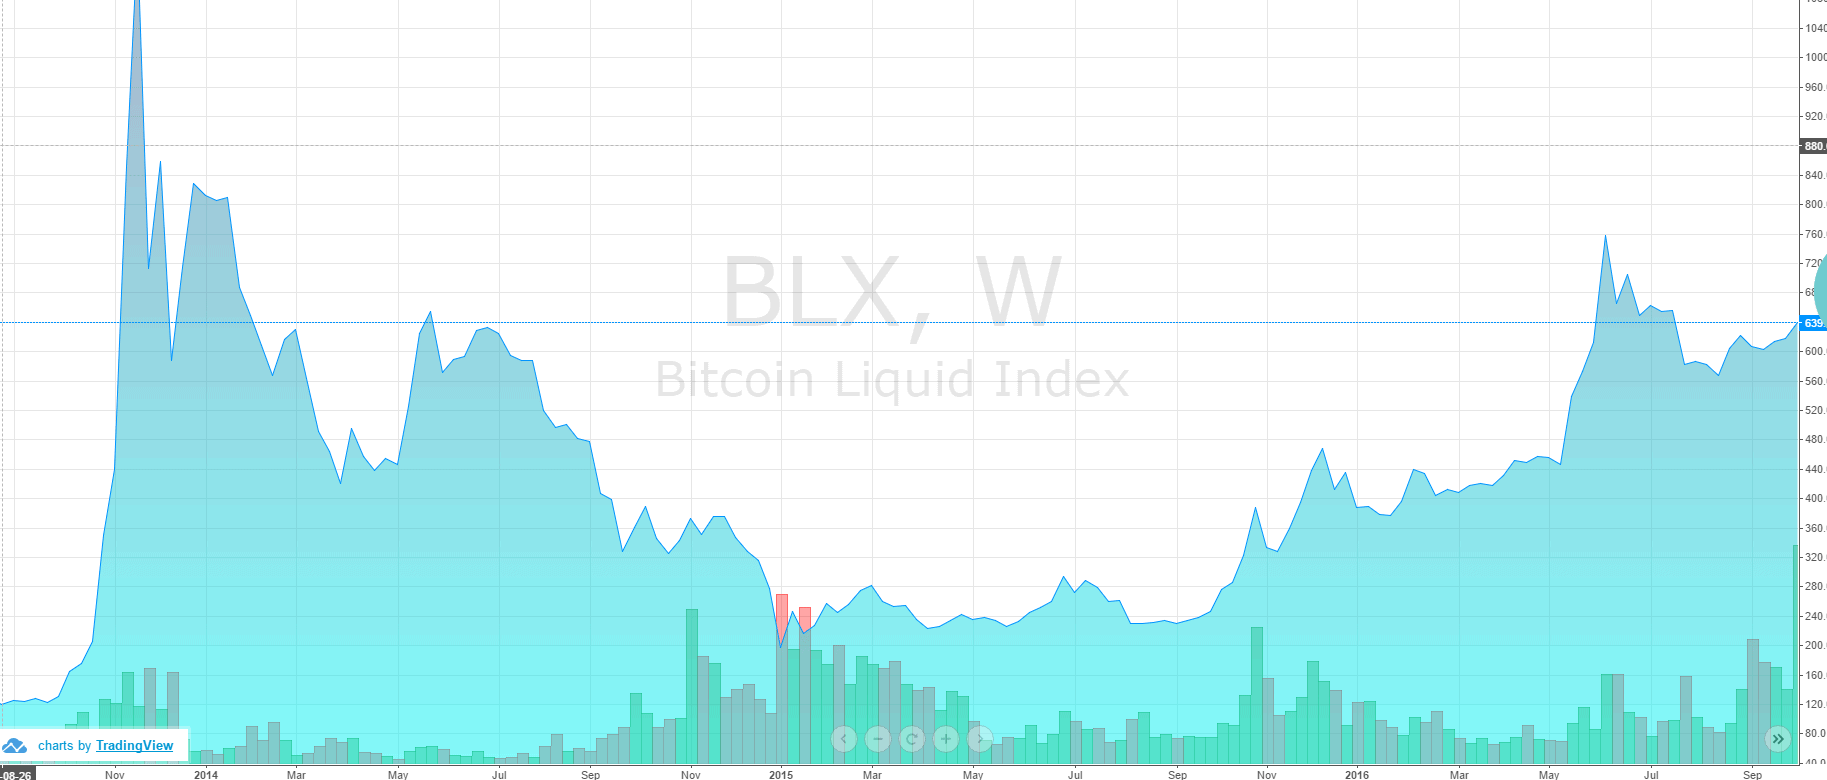
The long term Bitcoin chart is extremely bullish, with solid support for the current bull market on the form of extreme volume. That being said, Bitcoin is showing some short term divergence that needs to be resolved before the trend continues.
Bitcoin Technical Price Analysis: SegWit, ETF's 45 days to go, European Crisis and China.
The technical setups posted below use simple trend detection, support and resistance, channels, pattern and candlestick analysis. We aim for high-probability trade setups on BTCUSD and use very few indicators. All charts use BNC’s Bitcoin Liquid Index for maximum accuracy.

The technical setups posted below use simple trend detection, support and resistance, channels, pattern and candlestick analysis. We aim for high-probability trade setups on BTCUSD and use very few indicators. All charts use BNC’s Bitcoin Liquid Index for maximum accuracy.
