MANA Price Analysis: Finding value in ‘decentralized’ virtual reality

![]()
As the native token of the Decentraland network, MANA currently has limited utility in the fledgling virtual world where it acts as a medium of exchange. Despite this, Decentraland ecosystem participants appear willing to make large purchases of virtual property in Decentraland — driving price and network activity.
MANA is the ‘within ecosystem’ token of Decentraland, an Ethereum based virtual reality platform. Within the virtual world, users purchase digitized plots of ‘LAND’ which essentially becomes theirs to do with as they please.
A user can create games, apps and other monetized content within their owned land . This is created as a ERC 721 token which can later be sold on the Dentraland Marketplace. In the last month, the most expensive piece of land sold was valued at 226,666 MANA or ~$15,866 and the average cost of a piece of LAND was ~$1,852.
The imaginative, Westworld style utopian digital value proposition of Decentraland is clearly appealing for the technologist within us, and it is not surprising that the project’s ICO attracted $24 million in 35 seconds, while drawing in over 10,000 interested investors, many of whom were turned away because of a cap on buy-ins.
Turning dreams into virtual reality takes time, however. Despite a number of updates to the ecosystem in 2018, including a staked voting system, the ability to extend land purchases to estates and the launch of Software Developers Kits (SDKs) to let users start building projects on top of their land, activity within the network is yet to achieve any significant scale.
The ability to perform tangible activities on Decentraland like exploring other user’s plots of LAND or playing and developing within games and Dapps within owned LAND is limited, with the network VR capabilities currently rudimentary.
This means that in November 2018, the MANA utility token doesn’t really have much utility. While what has been built is impressive and exciting, the Decentraland landscape is scarce and VR structures on the network are at a very early proof of concept stage.
For believers in the project and current buyers of LAND, it is not really about what Decentraland is right now, but what it could be if the project is fully realized.
This is a big ‘if’ for a couple of reasons. First, because of the technological challenge of building a consumer grade, fully decentralized, VR ecosystem — and second, because of powerhouse competitors like Sony who are building their own explorable VR world solutions (albeit without the decentralized do-it-yourself appeal of Decentraland).
Active daily users on the network is generally stuck within double digits, and on a good day there will be over 50 transactions across Decentraland marketplaces. The next auction of unclaimed LAND plots will take place in either Q4 2018 or Q1 2019 based on polling in Decentraland’s voting protocol, which may generate some new organic user activity.
MANA currently trades at ~$0.077, down ~72% from an all time high of ~$0.255 achieved on January 9th 2018. Its price has been affected by general market bearishness surrounding crypto and natural corrections following the highs of Q4 2017 and Q1 2018. In addition, FUD associated with the Ethereum Dapp and ICO ecosystem has also been detrimental to MANA’s ability to generate positive price momentum across 2018.
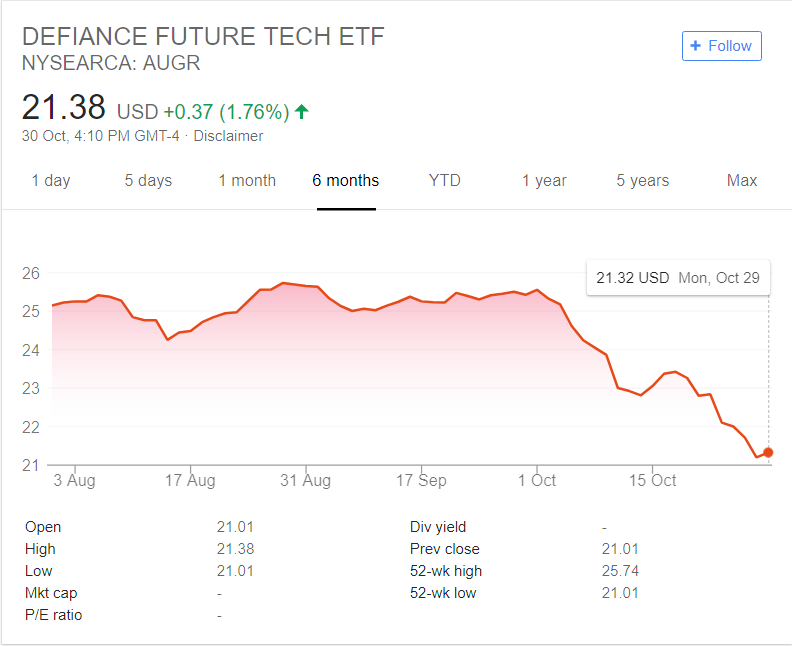
For investors favouring MANA because of the project’s tie to disruptive/VR tech, a recently launched ETF focused on investing in publicly traded companies building projects in the VR space, including SONY, Nintendo and AMD, may provide a useful indicator of sentiment within the sphere.
The ETF, AUGR, has observed a value drop of ~15% since launch on the 1st of August, however, this has more likely been associated with cyclical financial markets than fundamental factors.
Exchanges and trading pairs

Traditionally popular crypto pairings, BTC, ETH and USDT make up the overwhelming majority of MANA markets, with the trio comprising over 99% of daily trading volume. BTC makes up the largest chunk of this volume, just over 50% of the marketplace, or over 23 million tokens worth ~USD 1.62 million.

For interested buyers MANA is available on some of the most popular and liquid exchanges including Binance and Huobi. Binance’s MANA/BTC pair is a popular trading pair by exchange in the ecosystem, while the platform also offers an Ethereum onramp for MANA. Australian exchange TopBtc, lists the 2nd most popular trading pair by exchange with its own MANA/BTC pair.
How does Decentraland work?
LAND is purchased as a unique ERC 721 with a 33×33 feet cap, with no limit to height. Decentraland now also has an Estate option which lets a user buy plots near already purchased LAND.
LAND is attached to a district, essentially a community of plots which share a theme such as a Game or Dapp development focus. Owners can participate in local governance and decision making using Decentraland’s built in Agora voting protocol and the amount of LAND an owner hold correlates to the amount of power they have in decision making.
There are three layers of Decentraland blockchain; a consensus layer, which tracks ownership and land contracts through an Ethereum smart contract. A land content layer, where a decentralized distribution system renders the contract in the virtual world. And a real time layer that provides peer-to-peer connections for users to interact with each other.
The virtual reality world is built using Aframe. To build within the network, a model needs to be drawn up within Blender and then imported onto the platform.
Visually, Decentraland at this stage is crude and simplistic with pixels allocated to users by Proof-of-work. The capacity for developers to generate more complex models & architecture within their LAND is evolving. For example,. the latest Decentraland project update released this month announced SDK features such as lighting configuration & static scene options.
Network fundamentals
The NVT signal, a responsive blockchain valuation metric, developed & tested by Willy Woo and Dmitriy Kalichkin was derived from the NVT ratio. With NVT signal, the simplified framework is that crypto markets are prone to bubbles of speculative purchasing, not backed up by underlying network performance and activity — and the NVT signal gives off a signal for what stage of the price cycle a token may be in.
A high NVT signal is indicative of a network that is going through one of these bubble periods, and may move towards a position of becoming overbought/overvalued, because of the market’s speculative assessments running out of steam.
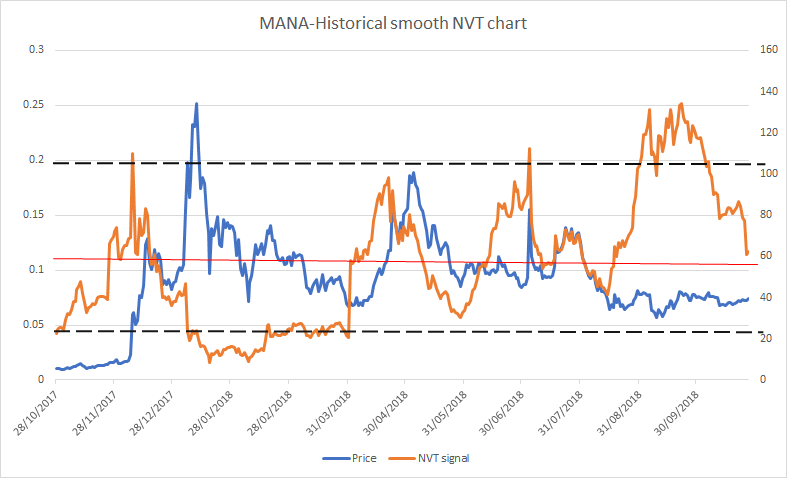
Figure 1: MANA historical NVT signal data. (NVT signal = Market Cap/onchain transaction volume, smoothed with 30 day MA, Overbought range >104, Oversold range <21, Mean : 57)
MANA’s NVT signal post-September tells a somewhat surprising story, since 18/09 price has risen by ~12% rising from $0.065 to $0.073. Over the same period NVT signal has fallen by 49%.
This indicates recent positive price momentum has been driven by strong onchain transaction volume rather than speculative assessments or trading activity on 3rd party exchanges.

Figure 2: Decentraland Marketplace MANA purchasing volume. Nonfungible.com
Dapp transaction activity from Nonfungible.com indicates that while there are only a limited number of users on Decentraland, many of them appear ready to make large purchases for digital plots of land that may or not be worth more in the future.
One address in particular appears to have been a key driver of Decentraland market activity during September 2018, spending over $555,000 USD over 312 transaction on purchasing LAND. The address has at frequent time intervals withdrawn large swathes of MANA from exchange wallet addresses (Bittrex, Hitbtc), ensuring that the owner always has a float of MANA ready to make purchases quickly on the Decentraland marketplace.
The address may represent a consortium, or just a single individual willing to buy big into the Decentraland network. In general it appears that a few address dominate buying activity of LAND.

In recent months, this within ecosystem activity has been strong with a number of individual LAND sales exceeding $50,000. Based on NVT signal implications, it is this within ecosystem buzz that is pushing forward price momentum, rather than the speculative trader activity that generally drives price upwards in crypto markets.
If NVT signal continues to trend downwards towards the mean and ‘oversold’ region then there is a possibility of speculative trend reversal, with ‘speculative’ factors kick and creating an alternate pressure source for forward price momentum.
Important upcoming dates to observe network activity will be future auction dates when unclaimed LAND will be sold outside of the peer-to-peer marketplace. One would expect onchain volume to jump around auction dates.
Price to Metcalfe Ratio
Metcalfe’s law is a measure of connections in a network, as established by Robert Metcalfe the founder of Ethernet. It has subsequently been used to analyze the true value of network-based financial products like Facebook and Bitcoin, and by comparing it to price, can provide a useful tool to assess whether a token is over or undervalued.
It is also a more straightforward metric to implement versus onchain transaction volume, which can be challenging to measure accurately in USD terms. Active addresses are measured as the number of unique sending and receiving addresses conducting transactions on the given day.
This makes it a relatively transparent metric as compared to onchain volume. However, there may be a question of the granularity of the data, and who controls these addresses.
Unlike the healthy onchain transaction volume, active address/connection growth tells a very different story. As mentioned earlier, daily user activity on the Decentraland marketplace barely crosses 50 on a good day, and within the virtual world there is very little to spend MANA on in terms of within ecosystem purchases.
Price to Metcalfe Ratio (PMR) signal hovered in a range between 6 and 7.5(natural log points) for most of 2018. In a number of instances price/token value appears to be moving before PMR, limiting its potential as an indicator for predicting speculative price bubbles within MANA.
Currently PMR appears to be flirting with approaching a historically indicated oversold level, contradicting NVT signal. This indicates that the network may be approaching an inflection point where the price support provided by Decentraland’s small user base may be close to breaking, if this occurs a wave of downward pressure will be put on MANA’s price.
The clear explanation for the opposite direction between user activity and onchain volume, is that currently Decentraland resembles a enthusiasts/technologists playground. Where savvy investors are willing to bet big on LAND purchases, but this investor space remains fringe & niche, yet to achieve real scale.
The Decentraland project is likely to mature with more users and activity updates are rolled out and the MANA product begins offering consumer-grade solutions. This is likely to take a while to deliver, however, and the network will probably have to deal with the pressure of a high PMR for some time.
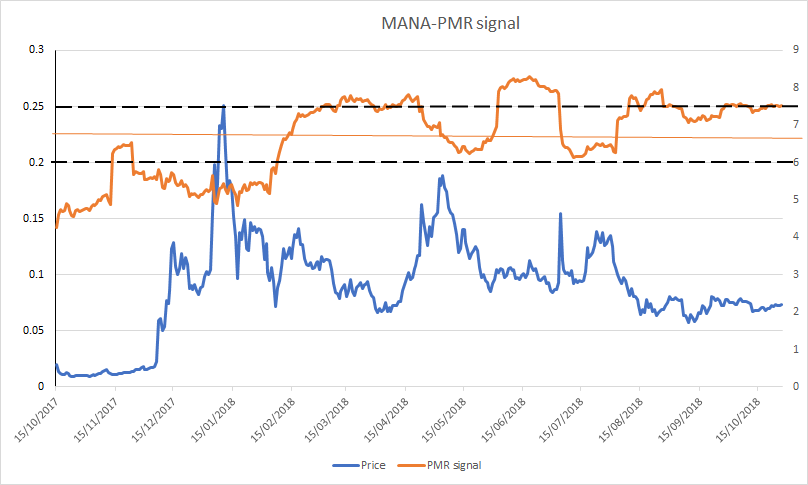
**(Fig 3. MANA Kalichkin’s PMR or Price to Metcalfe, Natural log of Token value/Metcalfe Ratio. Meltcalfe Ratio = Active Addresses Squared, Overbought >7.3, Oversold<5.7, Mean : 6.7) **
Network momentum
Network momentum is a Blockchain indicator metric conceived by analyst Positivecrypto. Indicated by the faded grey line in figure 2, It assesses onchain volume as an indicator for future price movements. Where the metric differs from NVT signal, is that it measures daily volume of token transactions in MANA terms, rather than the USD value of onchain transaction volume that is used when making assessments using NVT signal.
The simple intuitive idea is that a rising rate of Onchain volume is a signal for growing ‘momentum’ within the network, which eventually feeds back into price and vice versa for falling on chain volume in token terms.
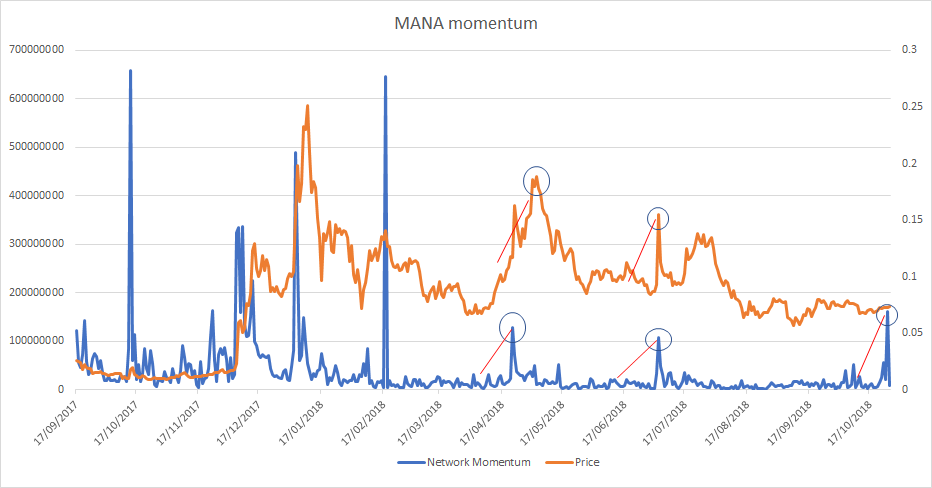
Figure 4.
MANA Network Momentum
Network Momentum for MANA appears volatile and prone to rapid fluctuations. Despite this, on a number of occasions in the past year as shown in figure 4, rising momentum has correlated closely with rising price. Indicating that the metric is built into MANA’s value and the intuition behind it likely fits the Decentraland network.
This in mind, network momentum spiked sharply around the 25/26th October. Based on two previous correlated spikes in April 2018 and June 2018, an equivalent forward price run driven by the most recent network momentum jump may be expected.
Like NVT signal, growing activity on the Decentraland marketplace is likely the largest factor in Network Momentum surges.
Technical Analysis
Long Term Trends
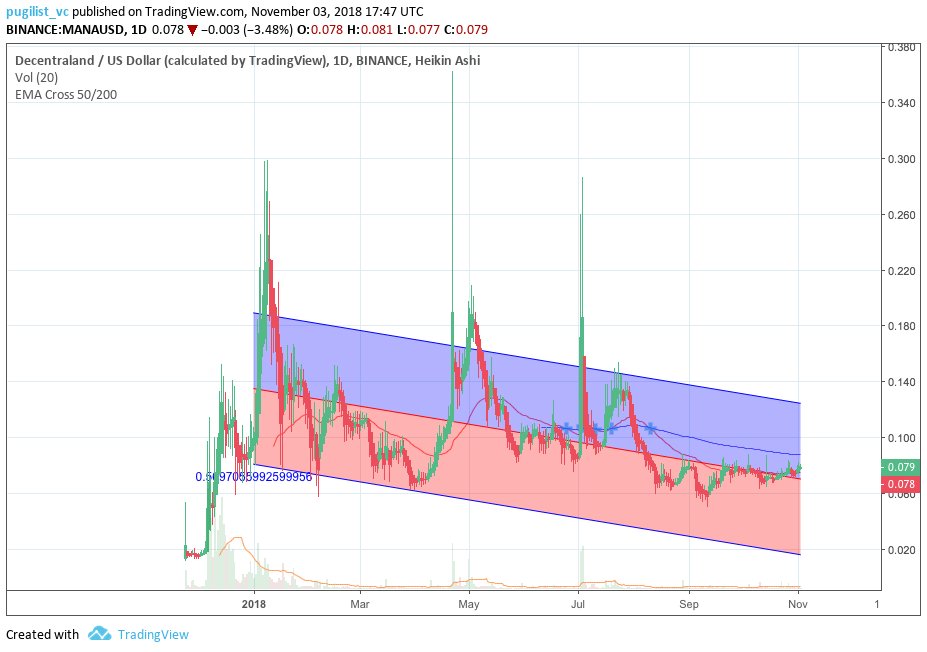
In 2018, the price of MANA has fallen ~22%, visualized by the negative linear price trend with a Pearson R correlation coefficient between time and price of 0.57, on the 1 day chart. Despite the losses, MANA has still performed considerably better than the broader digital asset market in 2018. Additionally, despite several golden cross attempts, the death cross has persisted since early August. However, price is currently using the 50 day EMA (red line) as support, which is positive for price. MANA is currently sitting at ~$0.077 and appears to be basing along the average trend path.
Similar to the broader digital asset market, price volatility for MANA has been diminishing since mid-September, visualized by the compressing bollinger bands and historically low volatility (blue line).
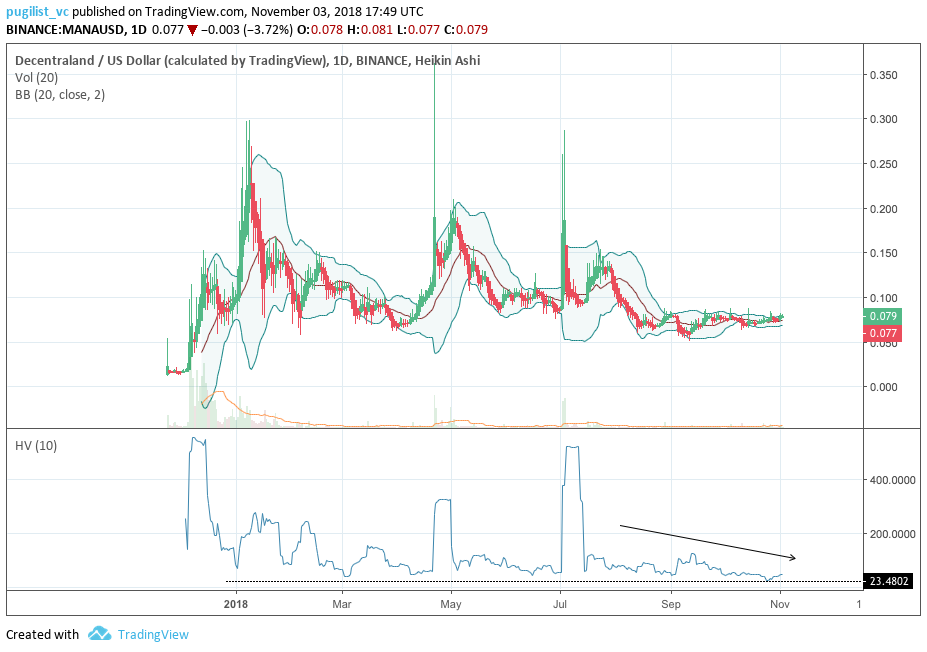
This volatility compression typically precedes a price breakout in one direction. Currently, price is confined within a trading range between $0.066 and $0.085 with no real indication on which direction a breakout may occur. Given the high market dependence on bitcoin (BTC), coupled with the 0.57 correlation between BTC (red line) and MANA (blue line) in 2018, the direction of MANA’s price breakout may be determined by the movements in bitcoin more so than its own fundamentals.

- onchainfx.com
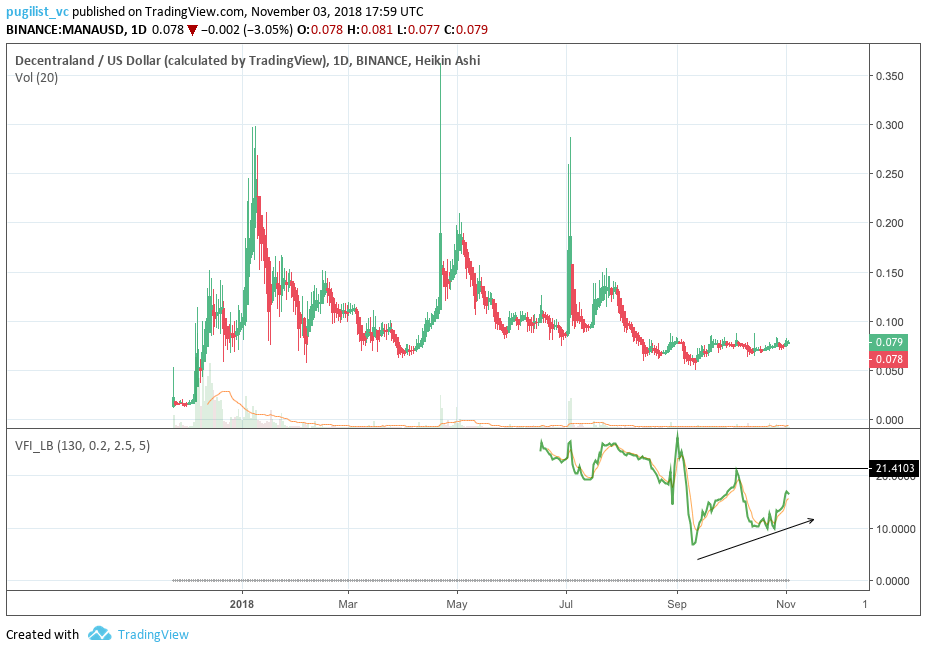
Lastly, the volume flow indicator (VFI) has never fallen below 0 in MANA’s short time in existence, despite subtle losses in 2018. This fact coupled with VFI trending higher currently may provide a positive signal for a future price breakout to the upside if price can breakthrough the 21 resistance level (black line). The VFI interpretation is: a value above 0 is bullish and below 0 is bearish, with divergences between price and oscillator being high probability signals.
Ichimoku Clouds with Relative Strength Index (RSI)
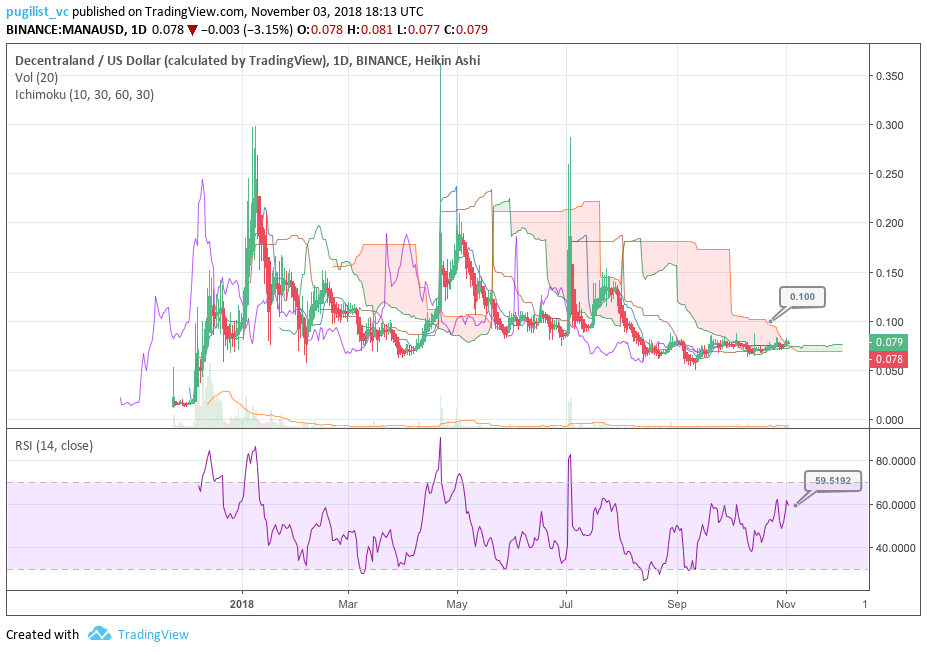
The Ichimoku Cloud uses four metrics to determine if a trend exists; the current price in relation to the Cloud, the color of the Cloud (red for bearish, green for bullish), the Tenkan (T) and Kijun (K) cross, Lagging Span (Chikou), and Senkou Span (A & B).
The status of the current Cloud metrics on the 1 day time frame with singled settings (10/30/60/30) for quicker signals is mixed; price is above the Cloud, Cloud is bullish, the TK cross is bullish, and the Lagging Span is below the Cloud and touching price.
A traditional long entry would occur with a price break above the Cloud, known as a Kumo breakout, with price holding above the Cloud. From there, the trader would use either the Tenkan, Kijun, or Senkou A as their trailing stop.
MANA is currently sitting at $0.077 and performing a Kumo breakout with price slightly above the Cloud. The VFI, low volatility, and slight uptrend in price makes a sustained Kumo breakout more likely in the near term. However, one point of concern for the viability of the current breakout would be the RSI at 60 and inching closer to overbought territory. The support levels for price are $0.069, $0.06, and $0.05; while price targets for a sustained Kumo breakout are $0.08, $0.09, and $0.10.
The status of the current Cloud metrics on the 1 day time frame with doubled settings (20/60/120/30) for more accurate signals is mixed; price is in the Cloud, Cloud is bearish, the TK cross is bullish, and the Lagging Span is below the Cloud and touching price.
As mentioned, MANA is currently sitting at $0.077 and currently performing a Kumo breakout on the faster Ichimoku settings. However, using the slower Ichimoku settings, the probability for a successful Kumo breakout is far smaller. In the unlikely event of a successful Kumo breakout, price will need to breach $0.17 with price targets of $0.18, $0.19, and $0.20.

Conclusion
MANA’s instantly exciting and easily attachable value proposition has made it one of the most discussed and popular ERC20 tokens in the crypto spaces and it has accumulated a sizable valuation and market cap.
Despite the lingering excitement surrounding the project’s potential, the network’s value has significantly diminished in 2018, as the overarching blockchain ecosystem has faced ICO, Dapp and utility token FUD, and market corrections, following skyrocketing prices in Q4 2017 and Q1 2018.
Onchain metrics indicate despite limited network usage, there continues to be a steady flow of high value virtual LAND plot purchasing within Decentraland, indicating fundamental support for the network. This should mature as the network continues to roll out more complex features.
The technicals for MANA in 2018 have been slightly bearish, but shown periodic signs of positive momentum. The prudent short term trader (10/30/60/30) will view the current Kumo breakout positively and potentially look to enter a long position with realistic price targets of $0.08 to $0.09. The longer term trader (20/60/120/30) will await a positive TK cross and Kumo breakout above $0.17 before entering a long position with price targets of $0.18 to $0.20. Both trader’s support levels are $0.069, $0.06, and $0.05.
 Brave New Coin reaches 1M+ engaged crypto enthusiasts a month through our website, podcast, newsletters, and YouTube. Get your brand in front of key decision-makers and early adopters in 2026. Limited slots remaining! Find out more today!


