Numbers that count: Debunking the fundamentals of BTC money flow

![]()
We are still in the early days of research into the effects of bitcoin transaction volumes on-chain and on-exchange to filter one from the other and sort the spam from the valid transactions. While there isn't universal agreement on one pure metric we can at least acknowledge some of the fallacies of measuring transaction volume and Bitcoin supply/demand and look at the latest efforts from various resources to gauge real volume
While most crypto traders focus on the charts and technical analysis, understanding the fundamentals of real supply/demand in opaque markets with fake volumes and unused coins could be invaluable to trading. Finding a true measure of transaction volumes for bitcoin is particularly tricky due to the obfuscation of mixers, unspent transaction outputs (UTXO) and privacy settings.
As there is no natural demand in the crypto market (i.e. few use cases outside speculation) then fundamental metrics like the network value to transaction ratio (NVT) may give us the wrong impression of network uptake if we don’t discern between real and speculative demand and the flow of money from miners and exchanges which at the moment are the only "real use cases" for crypto.
Mining Difficulty Vs BLX Price rate of change oscillator (ROC)
One of the most constant and important money flows in the bitcoin ecosystem is that of the mining industry. Miners and exchange operators are the only "natural players" in crypto that need to regularly liquidate large bitcoin holdings to fund their operations. Understanding when these large liquidations are more likely to happen or when miners are more likely to hold and wait for prices to improve could prove valuable to traders.
To this effect, BNC has used its BLX price data to track the rate of change of the bitcoin global spot price against the change in difficulty rate, the logic – a differential to anticipate when price reaches a certain momentum above mining difficulty that it would be desirable for a miner (and by deduction an exchange) to liquidate large holdings; or, conversely, when price is so low that miners must hold on to get back above break-even and into profitable territory.

The orange line plots the rate of change of the BLX price against the rate of change in mining difficulty; the grey line is the BTC price measured on the right-hand axis. Price momentum is nearing "overbought" levels compared to the mining costs when it enters positive territory, or when mining difficulty is increasing faster than price momentum the line moves towards oversold, negative territory.
The difficulty rate changes every 2016 blocks, or roughly every 10-14 days, and the BLX price change is only measured on those days that difficulty changed (the rate of change being the difference between it and the price 2016 blocks previous). For example, if the difficulty changed today after 13 days since the last change….
ROC (difficulty) = (diff_today – diff_13daysago) / diff_13daysago
ROC (price) = (price_today – price_13daysago) / price_13daysago
Traders use numerous ROC trade signals including price divergences and center-line crossovers, but in this case we are focusing purely on the overbought/oversold thresholds to signal buying and selling exhaustion.

Between April 2014 to 2017 the oscillator showed many more accurate "overbought" signals and was less accurate on the "oversold" signals.
As mining difficulty is an exponential function and the energy input costs for miners are so variable that finding a break-even price for miners is a constantly moving target, we have used the momentum of mining difficulty as an proxy for miner costs. Finding points of exhaustion in price-to-cost momentum with such an oscillator might be a better proxy for break-even than one particular price target.
We can see since October 2017 the oscillator breached oversold thresholds on the ROC (exhaustion levels) at around -20%, which lines up with a price floor around $6,000, suggesting a break-even area at that time. Positive threshold breaches above ~8% have generally preceded a sell-off within a week – apart from the Dec-Jan run which saw an anomalous surge in both price and difficulty rate, exaggerated by spam transactions and exchange speculation.
While oscillators are generally more useful in choppy markets and less so for trending, this ROC has minimized the noise and over a small sample size has indicated a coming change in trend, four bullish and three bearish.
However, the accuracy is caveated with a small sample size and the acknowledgement that price is used in the indicator as well as it being the measure we are trying to predict. There are also times when the oscillator failed to trigger trend changes, like in October ’17 when the signal reached oversold with no change in price direction and the parabolic price surge in November/December ’17 when the indicator failed to reach the "oversold" threshold.
Bitcoin days destroyed
Once cited on Blockchain.info charts and other data resources, the ‘Bitcoin Days Destroyed’ metric was used as a yardstick for the movement of old coins in the ecosystem. However, for reasons unclear it has been dropped from many websites though a vizualization can still be found at OXT.me and the raw data can be downloaded from Blockchair.
The metric multiplies the value of an incoming transaction to a wallet by the number of days it took for the same sum to leave that wallet. So if someone received 100BTC on Monday and spent it on Sunday the bitcoin days destroyed would be:
Received: 100BTC x 7 days = 700BTC days destroyed
Although it wasn’t a pure science it can be used as a rough KPI for network activity and may be viewed as an alternative to transaction volumes as it filters out spam transactions. Large spikes in BDD can be viewed as long-term holders selling (old) BTC to new speculators and a downturn in price is usually expected to follow. The largest BDD spikes have been in August 2017 and November 2017, following the bitcoin cash hard-fork and segregated witness implementation respectively.

The bitcoin days destroyed metric has been largely abandoned by on-chain data websites but can still be found on OXT.me under ‘BDD’.
Confirmed/Daily transaction counts
The number, or count, of daily transactions is one of the most widely cited metrics for the health of the bitcoin network, some interpreting it as the demand for BTC and economic activity. At first glance this seems like a logcial way to interpret the data – but if we look under the bonnet of bitcoin transactions we see they can have many monetary inputs and outputs batched into a single transaction, so we should take the daily tx figures with a grain of salt.
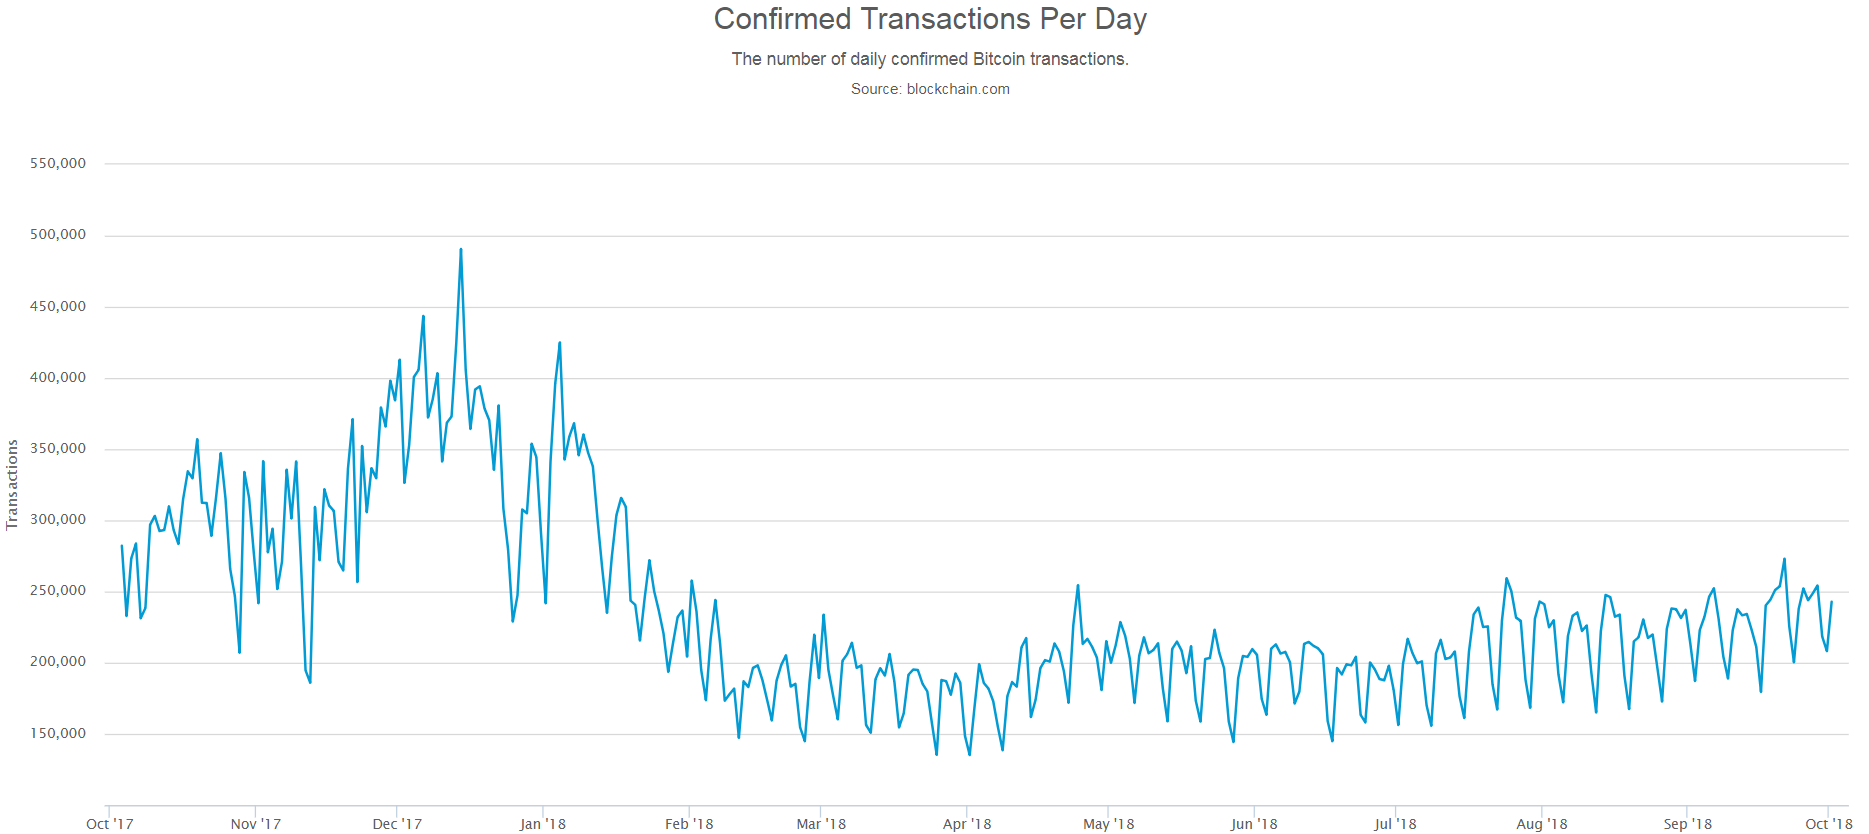
Transactions per day, or daily tx count, on blockchain.info
Data resource website Coin Metrics cautions using BTC transaction counts to deduce economic activity and suggests using a "payments per day" metric instead, which takes into account the so-called change outputs (satoshis sent back to the sender) in any transaction by counting the number of outputs in the transaction and subtracting one to exclude the change output.
**Behind BTC daily transactions: **
Coin Metrics uses the analogy of using the number of on-chain transactions to gauge the economic activity of bitcoin as akin to measuring the amount of postal mail sent in a day by counting the number of mail trucks on the road. Trucks (transactions) are full of boxes (outputs) that contain variable amounts of letters (satoshis) so it’s impossible to tell how many messages are actually being sent within those vehicles.
Every bitcoin transaction has an input and output though every transaction has an unlimited capacity for ins and outs and every block can handle an infinite number of transactions. In fact this is one of the most overlooked innovations of bitcoin: each transaction can be an aggregate of thousands of individual transfers.

The payments per day metric counts the number of outputs of a transaction and subtracts one (to exclude the change output)
Unspent Transaction Outputs (UTXO)
Unlike Ripple and Ethereum which operate on an account/balance model, the Bitcoin blockchain uses the UTXO.
Akin to transactions in the real world, more money is sent in a BTC transaction than is actually required (eg 1BTC for a 0.9BTC purchase) but instead of change being sent back to you in BTC it is cached on-chain and builds up over time. An individual can wait for the small change in UTXOs to accrue and when tx fees are cheap repatriate the cumulative sum.
Every transaction input must go into the UTXO database for it to be valid, otherwise it is considered a double spend or an effort to spend bitcoins that don’t exist.
__Behind Transaction volume: __
Coin Metrics cautions that bitcoin daily tx figures could potentially be exaggerated by a factor of 5-10x. They posit two reasons for UTXO blockchains having inflated figures:
- It’s hard to tell which outputs are genuine, and which are change.
- A large portion of bitcoin transaction volume comes from exchanges moving money around, or from mixers, and they’re hard to identify. Bitcoin, unlike Ethereum, works on UTXO model, similar to how transactions occur in real life.
Bitcoin batching volumes
Batching is a way to use the 2MB block space available for transaction processing as efficiently as possible. A batched transaction is usually considered to be a group of three or more tx. When a user sends frequent transactions, or sends multiple transactions in the same block, instead of of sending five individual 200 byte transactions that would take a total 1000 bytes of block space, they can batch all the outputs into one transaction of 300 bytes.

Batching of transactions over 4+ usually occur at exchanges, the smaller color ranges in the above graph. Batching volumes chart p2sh.info
As individuals rarely have reason to batch more than a couple of transactions, batching volumes over 4+ are viewed by some as a measure of exchange dominance. The common inference is that growing exchange batching volume shows bitcoin is used more for speculation than for real world transactions. However, this view might be overly simplistic because at the moment, exchanges remain the best infrastructure and trading the only real world use case for crypto until a merchant infrastructure is rolled out.
Behind batching:
Bitcoin batching volumes can also be used as a way to filter what on-chain transactions are coming to and from exchanges to discern how much total BTC is used for speculation; this is because now most of the big exchanges – but not all – batch their transactions to avoid a transaction fee price surge like last year. According to the most recent snapshot of batching volumes, exchange volume accounts for ~35% of on-chain activity.
According to Coin Metrics, although batched transactions make up an average of just 12% of all transactions, they move 30-60% of all BTC.
To sustain price, bitcoin needs a simultaneous large number of long-term investors to keep holding on to the asset and the number of daily transactions to also ramp up to create natural demand.
Amount of BTC stored or lost
To complement bitcoin days destroyed, we can use another metric to get an approximate amount of inactive currency held in "investment wallets". According to Diar research, the majority of circulating BTC is stored in investment wallets:
"Over 55% of Bitcoins currently sit in wallets that have balances upwards of 200 coins – worth over $1Mn at any point in time within the last 11 months when the price of Bitcoin breached the $5k mark. And impressively, 1/3 of the Bitcoins that are sitting in these wallets, have never made an outgoing transaction, which, outside of exchange wallets could indicate either lost private keys, lowering real supply, or a very strong resolve by cryptocurrency believers."

With other commodities like oil, steel, coal etc there is a significant amount of burn everywhere the raw product from the ground is consumed taking it forever out of circulation. In this sense bitcoin is different in that the raw product (notwithstanding the energy input) is not consumed. In theory, all bitcoins can potentially be infinitely recirculated.

Chainanalysis estimates 30% of BTC supply is likely lost.
Another on-chain data resource Chainanalysis estimates that at least 2.3m BTC and potentially up to 3.8m BTC is actually lost, while 4m BTC is still unmined. Meanwhile the amount of bitcoin held for speculation has gone up from 14% in April 2017 to 35% in April 2018.
Behind BTC concentrated ownership:
According to Diar, over 87% of all bitcoins are stored in wallets with 10 BTC or more (~$65,000), just shy of a cumulative $100b, which is owned by 0.7% of all addresses. The richest wallet address according to OXT posesses $1.1b in BTC, which has received 176 incoming transactions and had just 18 outgoing transactions. Of the top 20 richest addresses, there is only one that has made over 100 outgoing transactions (which appears to be an exchange sending batched transactions) and almost half haven’t made any outgoing transactions.

The average number of outgoing tx among the top 20 addresses was 59; minus the outlier second largest address the average is just 13 outgoing tx.
There appears to be an absurdly high concentration in BTC wealth – just 0.1% of addresses own 62% of total supply. While this may sound ominous from the point of view of market manipulation, it could be a case of genuine buy-and-hold investors as 42% of BTC held in the major wallets (over 200BTC) made no outgoing tx in the run-up to the Jan 2018 price peak and 27% of those wallets have continued to add to their holdings.
Conclusion
As we outlined above, the research into money supply and demand in bitcoin is in a nascent stage and is still being explored. Putting all the resources together is valuable for those trading off BTC fundamentals.
 Brave New Coin reaches 1M+ engaged crypto enthusiasts a month through our website, podcast, newsletters, and YouTube. Get your brand in front of key decision-makers and early adopters in 2026. Limited slots remaining! Find out more today!


