Stock To Flow – Measuring The Bitcoin Peak Using Data Science

![]()
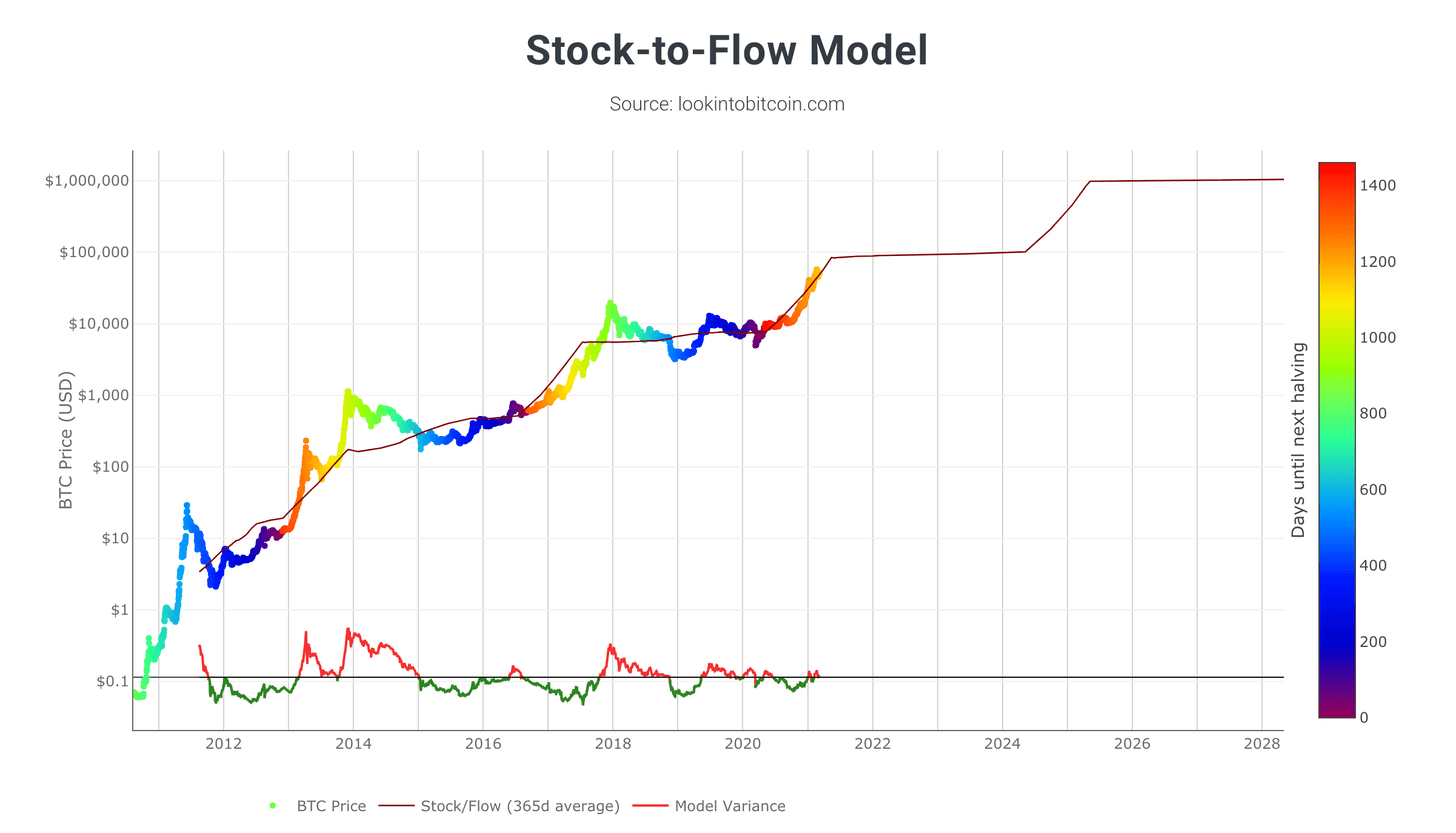
Technical analyst Rekt Capital looks at the Bitcoin Stock-to-flow model to assess the next Bitcoin market peak. In bull markets, Bitcoin overshoots the Stock-to-flow model.
Introduction
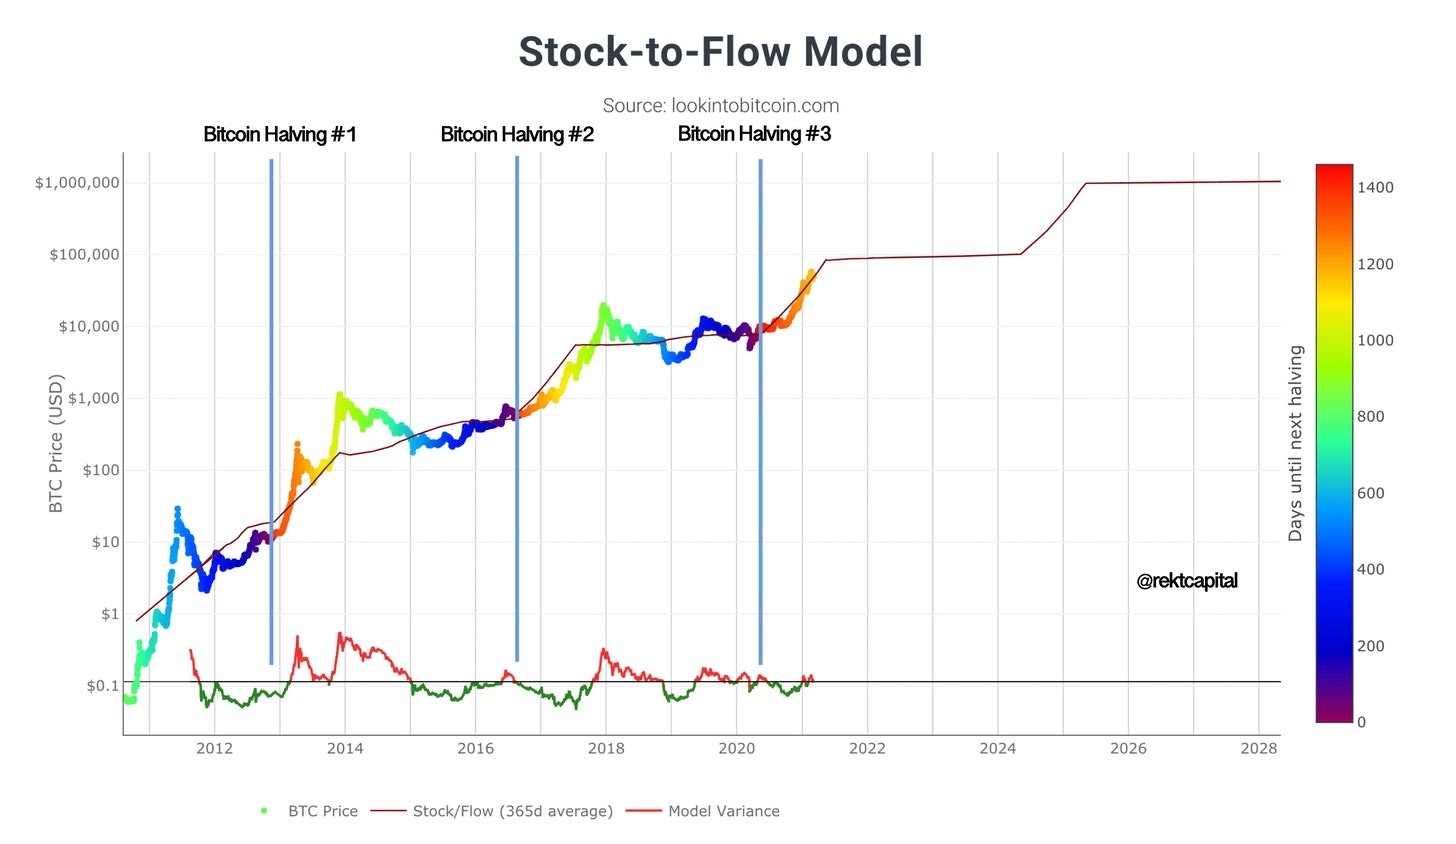
Every four years, a fundamental change occurs in the Bitcoin protocol that affects the amount of Bitcoin created every ten minutes or so. This event is called the Bitcoin Halving. The Bitcoin Halving tends to act as a major catalyst for exponential Bitcoin price increases. That is in large part due to the scarcity that the Halving event provokes. Scarcity enhances value. And the Stock to Flow model created by Plan B quantifies the scarcity of Bitcoin.
When a Bitcoin Halving event takes place, it affects the Stock to Flow of Bitcoin and inevitably its price as well:
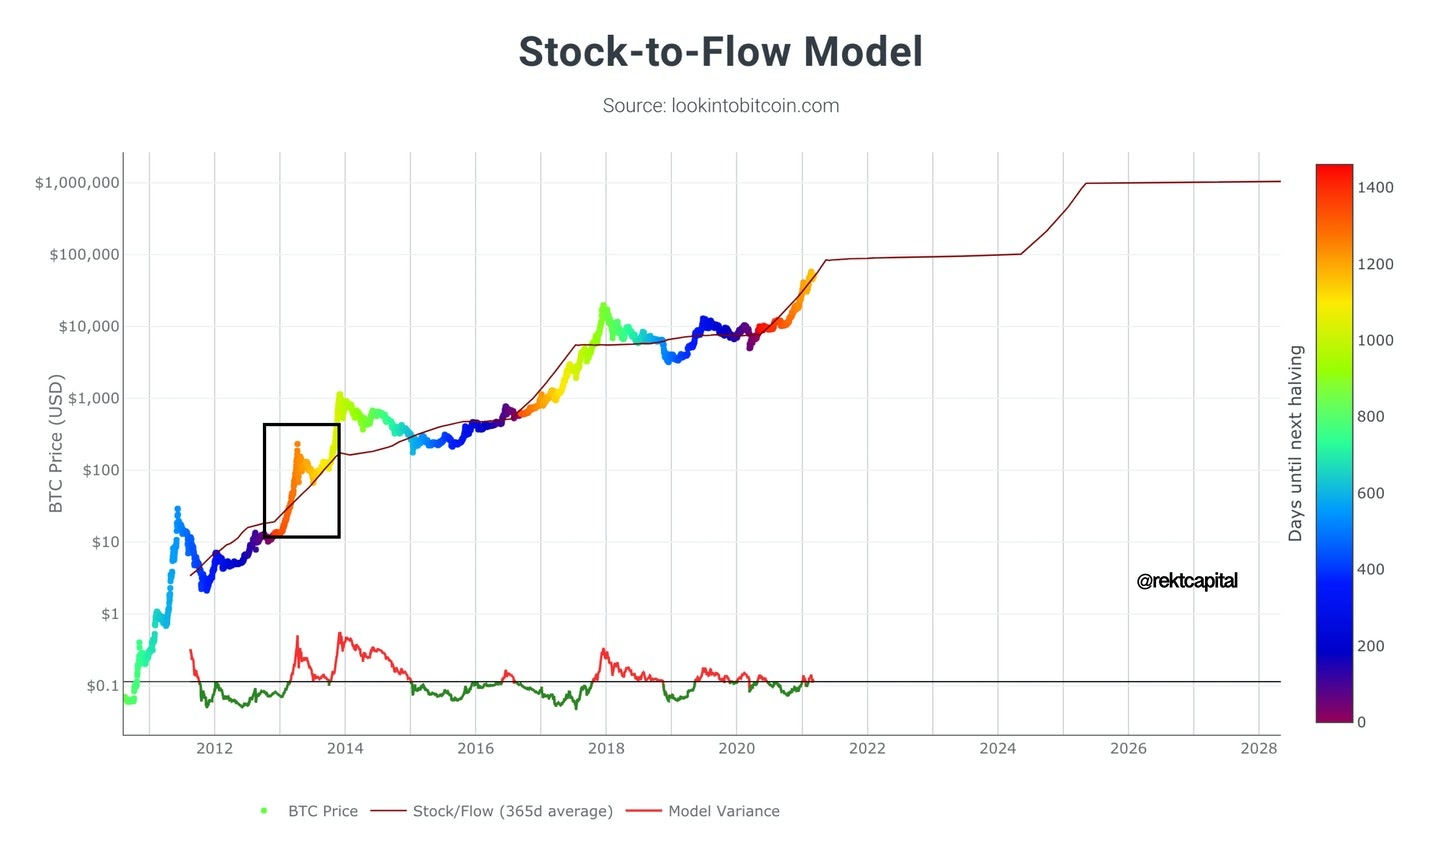
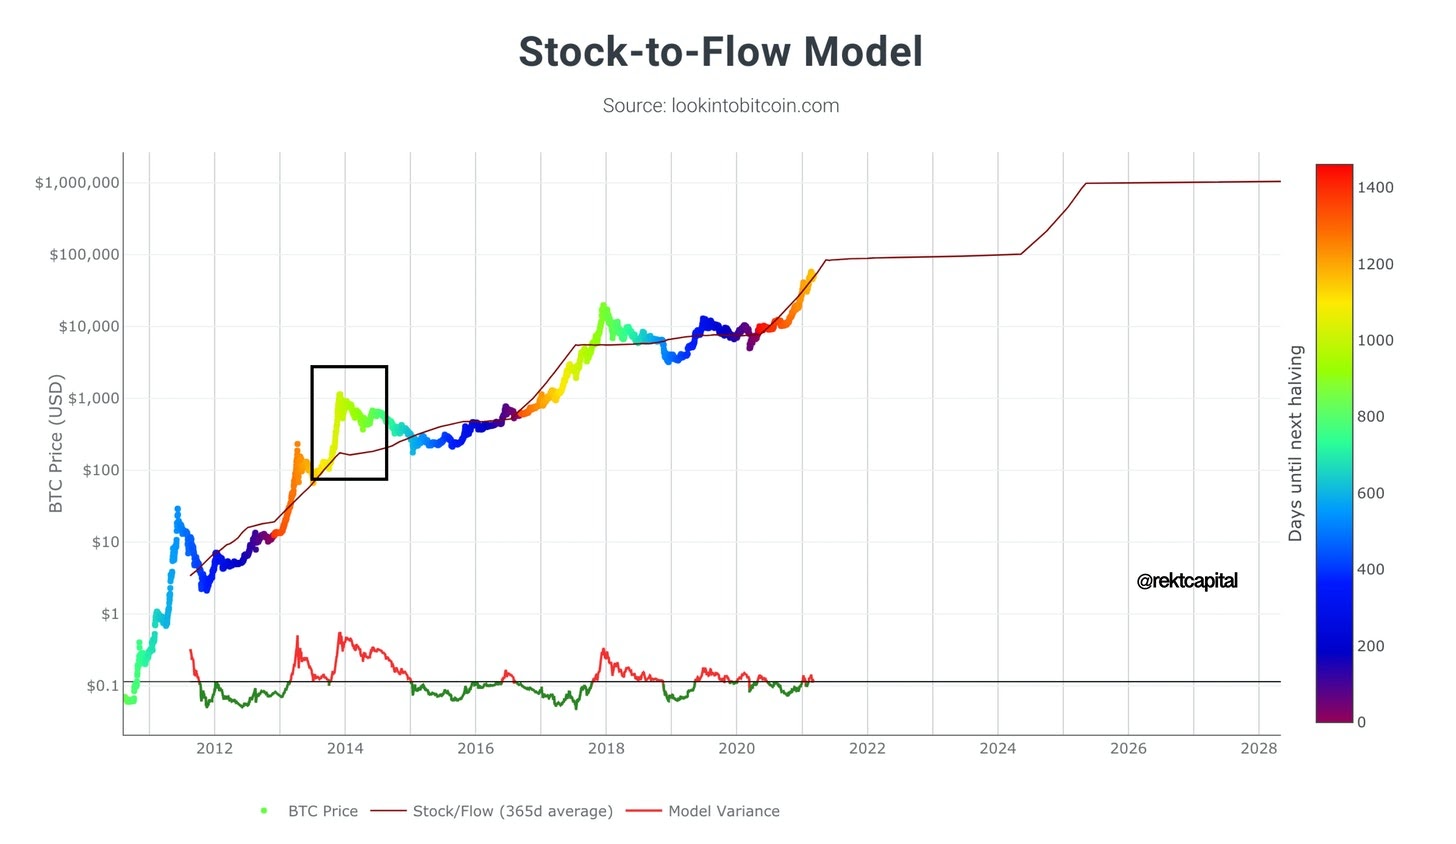
The Stock to Flow has been an accurate predictor of Bitcoin’s price action over the years. In fact, the price of Bitcoin has followed the Stock to Flow line for most of its price history.
That said, the focus for investors shouldn’t necessarily be about Bitcoin’s price following the Stock to Flow line. Instead, the focus should be on how Bitcoin tends to deviate from the Stock to Flow line.
Historically, it is these Bitcoin price deviations from the Stock to Flow line – whether to the upside or to the downside – that have preceded Bear Market bottoms and Bull Market tops in Bitcoin’s price.
Learning about these deviations will therefore prove useful for investors when it comes to timing the point of maximum financial opportunity for buying Bitcoin and timing the Bitcoin Bull Market peak.
This article will focus on the analysis of these Bitcoin price deviations:
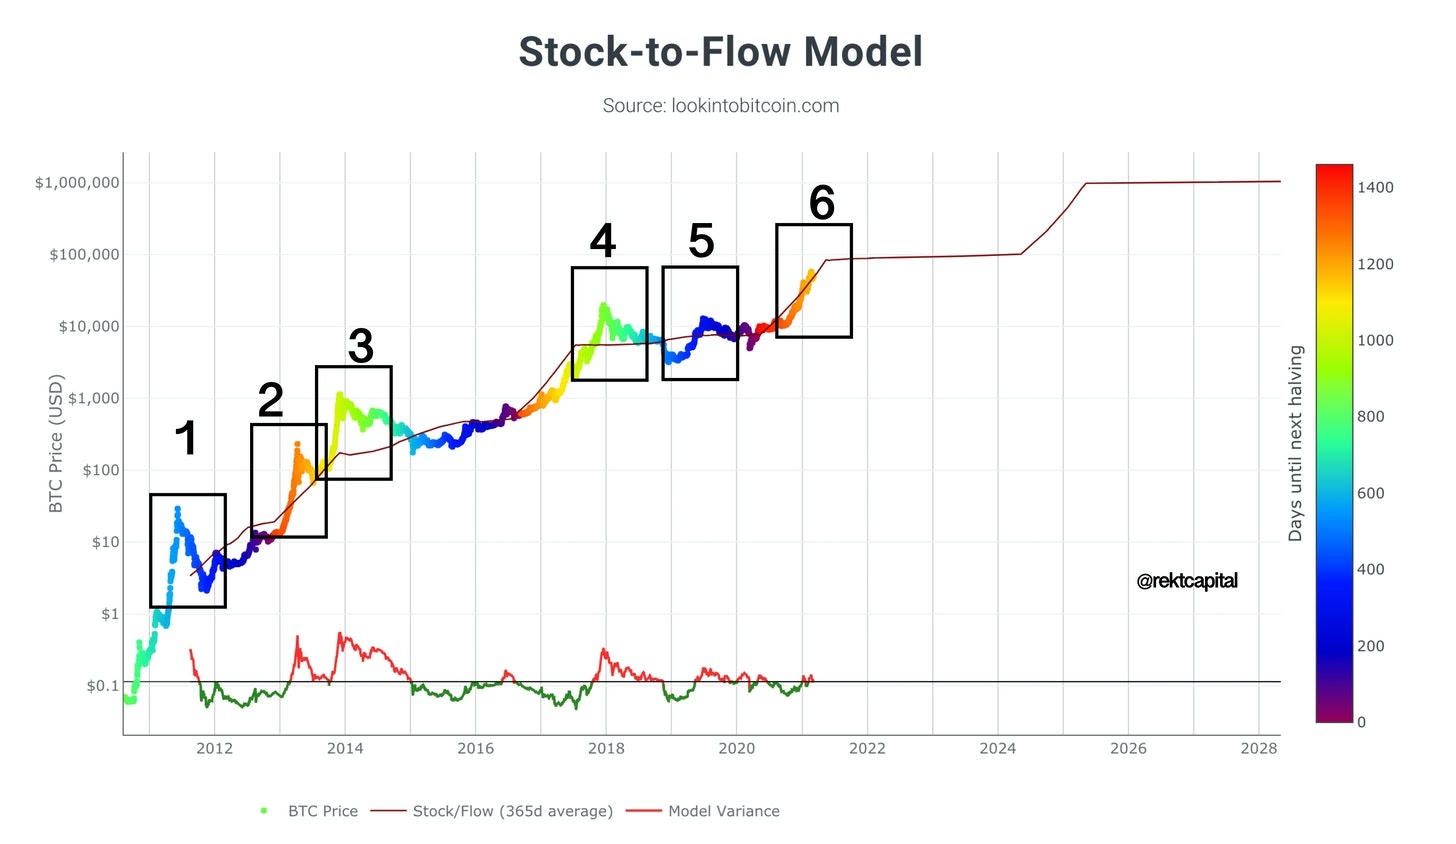
In this article, we will focus specifically on Bitcoin’s upside price deviations beyond the Stock to Flow line.
This will be done to learn about any historically recurring tendencies about these deviations and whether gleaning trends in these deviations could help us learn more about where Bitcoin’s price could peak in its current Bull Market.
This is Part 1 of my Stock to Flow series which will address the first three upside deviations in Bitcoin’s price from the Stock to Flow line. Part 2 will address the remaining upside deviations.
1. First Stock to Flow Upside Deviation (Bitcoin Bull Market Peak, June 2011)
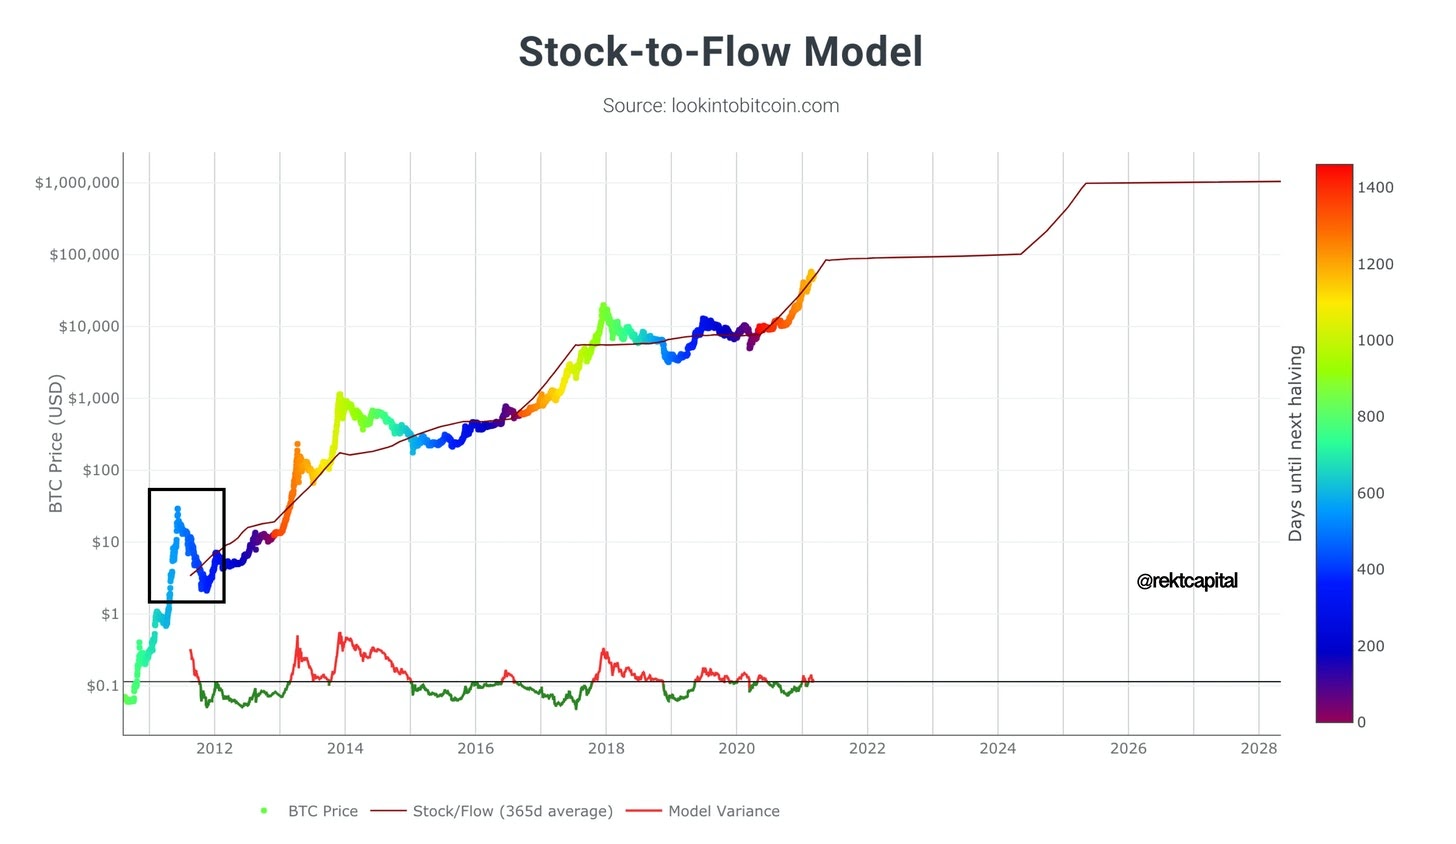
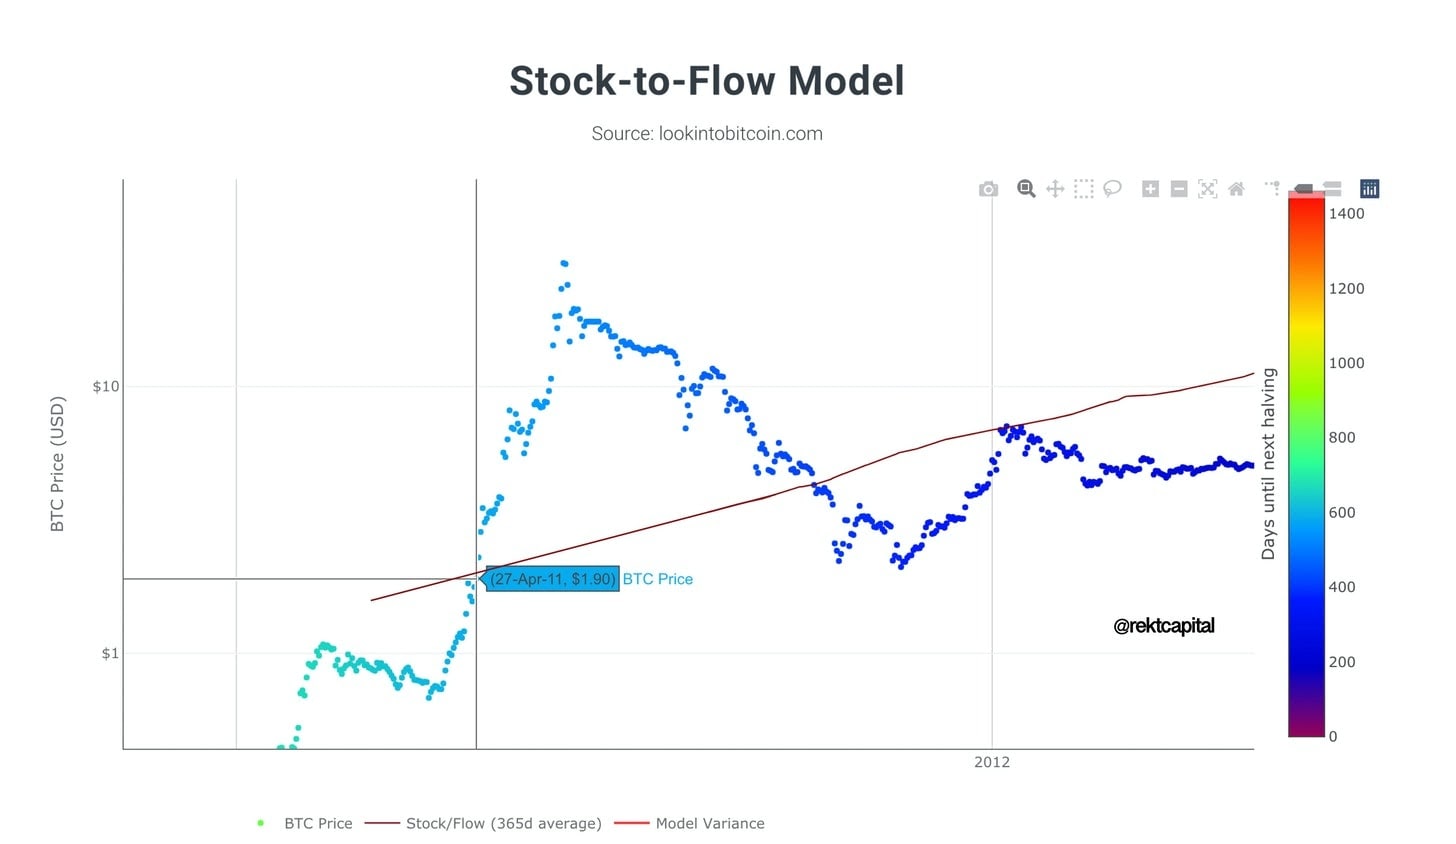
Let’s focus on the first instance where Bitcoin’s price deviated towards the upside, beyond the Stock-to-Flow line. This upside deviation from the Stock-To-Flow line occurred during the June 2011 Bitcoin Bull Market peak. As you can see, the Stock-To-Flow line doesn’t outline this period in Bitcoin’s price action very well. So I extrapolated the Stock-To-Flow line off-hand:

I did this to approximately determine two key details for this analysis:
- The potential price point at which Bitcoin was when it was breaking past the Stock To Flow line.
- The potential Bitcoin price point at which the Stock To Flow line was when Bitcoin’s price peaked in June 2011.
These two details will prove crucial in determining how much Bitcoin’s price deviated towards the upside from the Stock to Flow line before topping out in its Bull Cycle.
Based on this off-hand extrapolation of the Stock to Flow to this particular period in Bitcoin’s price history, the price point at which Bitcoin crossed the Stock to Flow line to continue its exponential uptrend was approximately $1.90:
In June 2011, Bitcoin’s price peaked at ~$28.79 before entering a new Bear Market. Based on my extrapolation, the Bitcoin price point at which the Stock to Flow line found itself during Bitcoin’s peak was approximately $2.29:
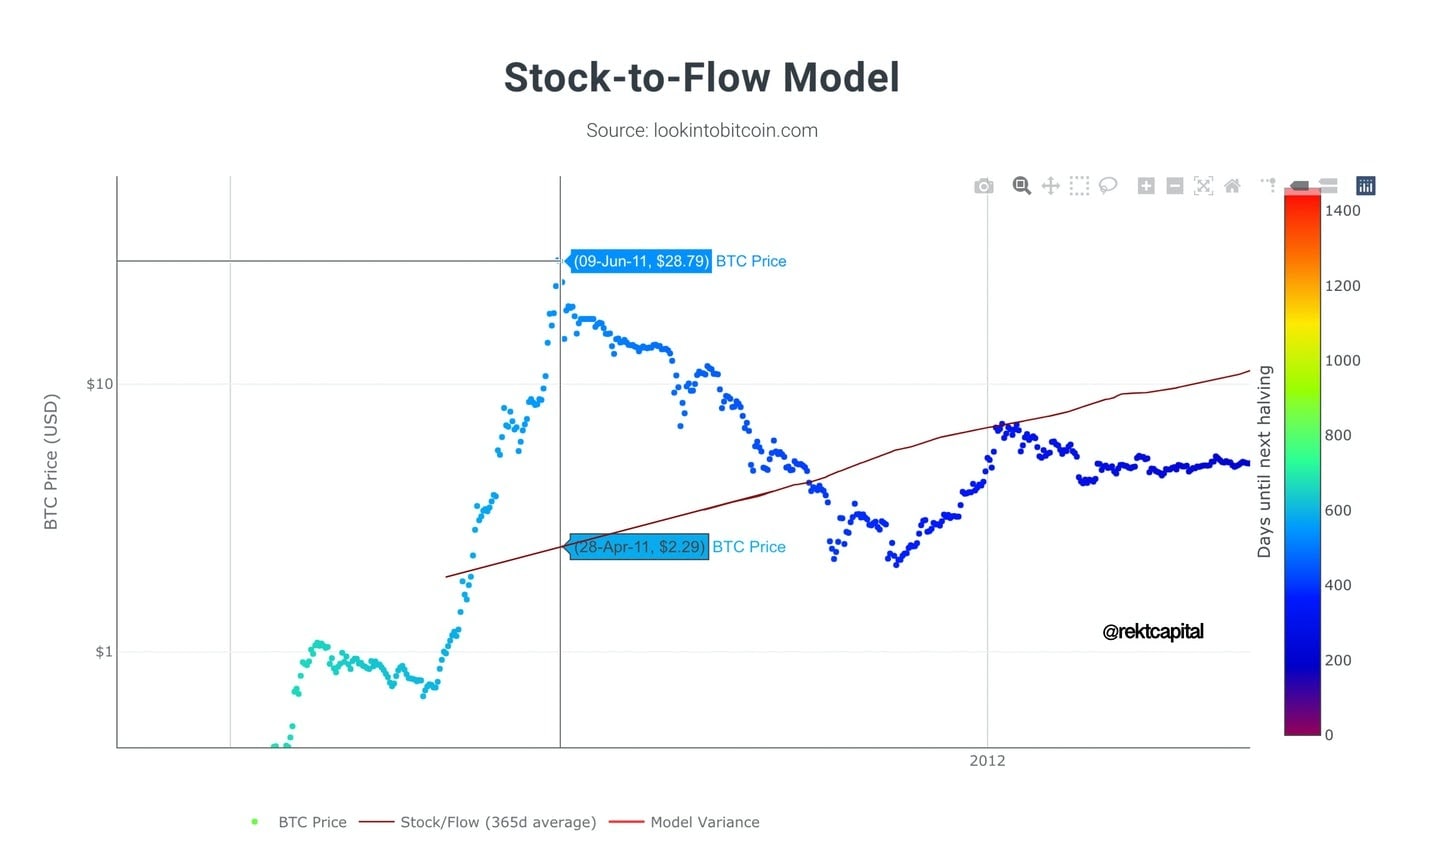
There are two things to note here:
Firstly and perhaps obviously – the Stock to Flow line increased over time. In late April 2011, the Stock to Flow line outlined a Bitcoin price point of approximately $1.90 whereas in early June it was approximately $2.29.
The key takeaway is that the Stock to Flow line can change over time as Bitcoin’s uptrend progresses.
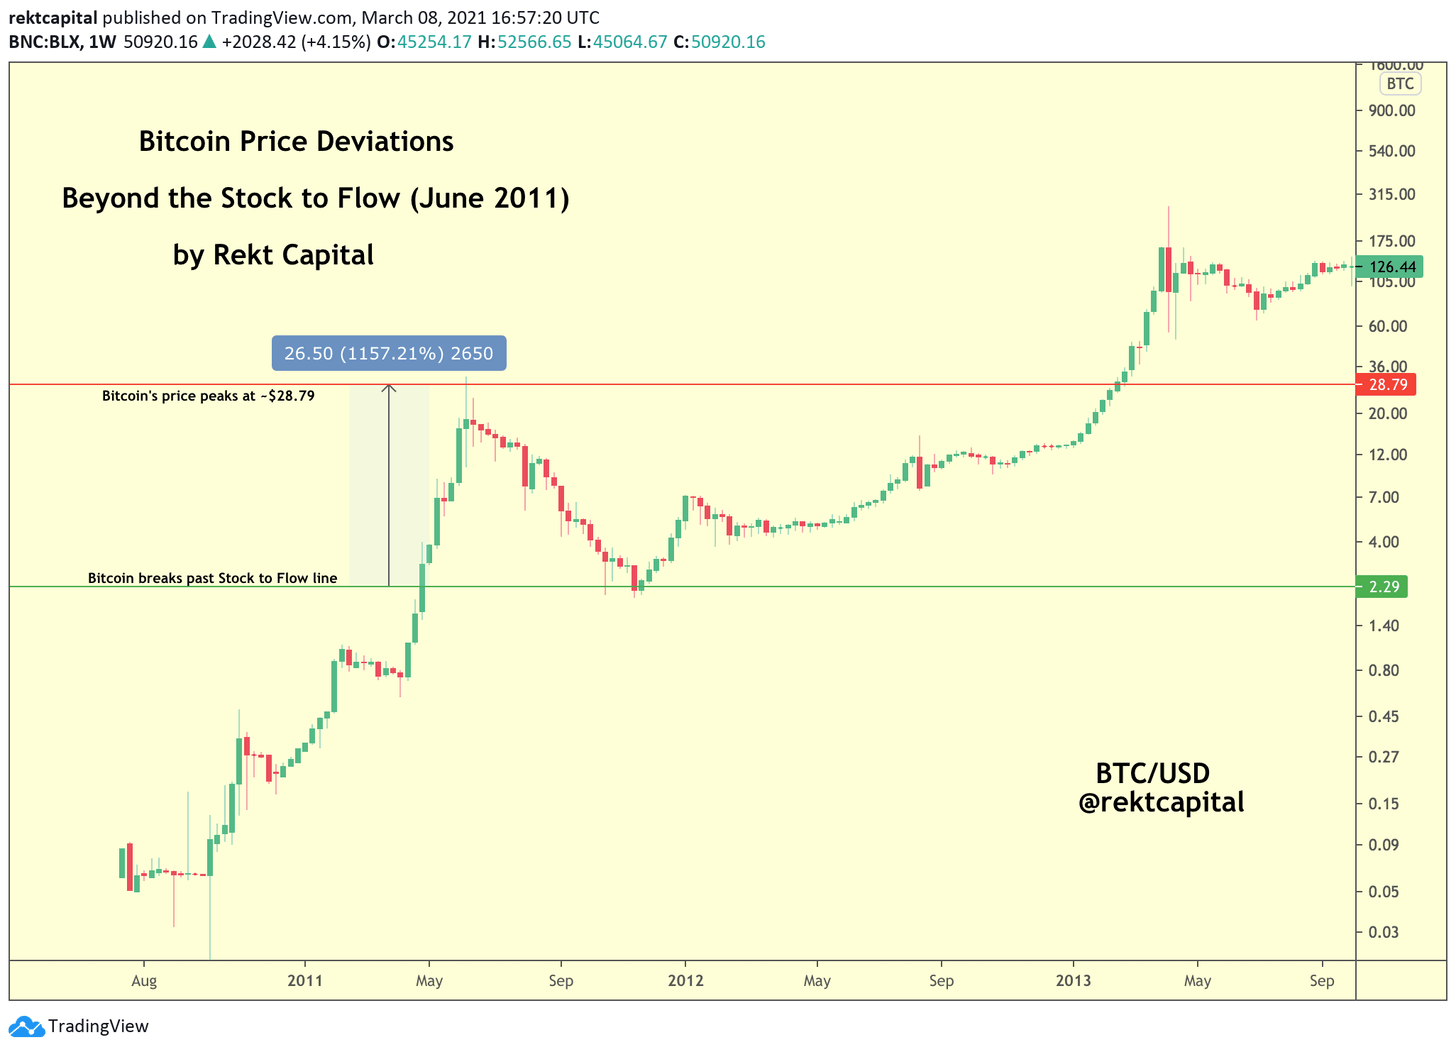
Secondly and perhaps more importantly for this analysis – Bitcoin’s price rallied approximately +1157% beyond the Stock to Flow line:
2. Second Stock to Flow Upside Deviation (April, 2013)
Let’s now turn our attention to the second time that Bitcoin’s price deviated to the upside, beyond the Stock-to-Flow line. This upside deviation occurred in April 2013.
As discussed in my Bitcoin Halving Series, this period marked a time where Bitcoin’s price experienced two market cycles after its first Halving.
That is, Bitcoin enjoyed a Bull Market uptrend in the immediate months after Halving #1 before enduring a catalyst-driven -80% Bear Market downtrend before once again recovering into a new Bull Market uptrend before once again experiencing a -86% Bear Market downtrend:
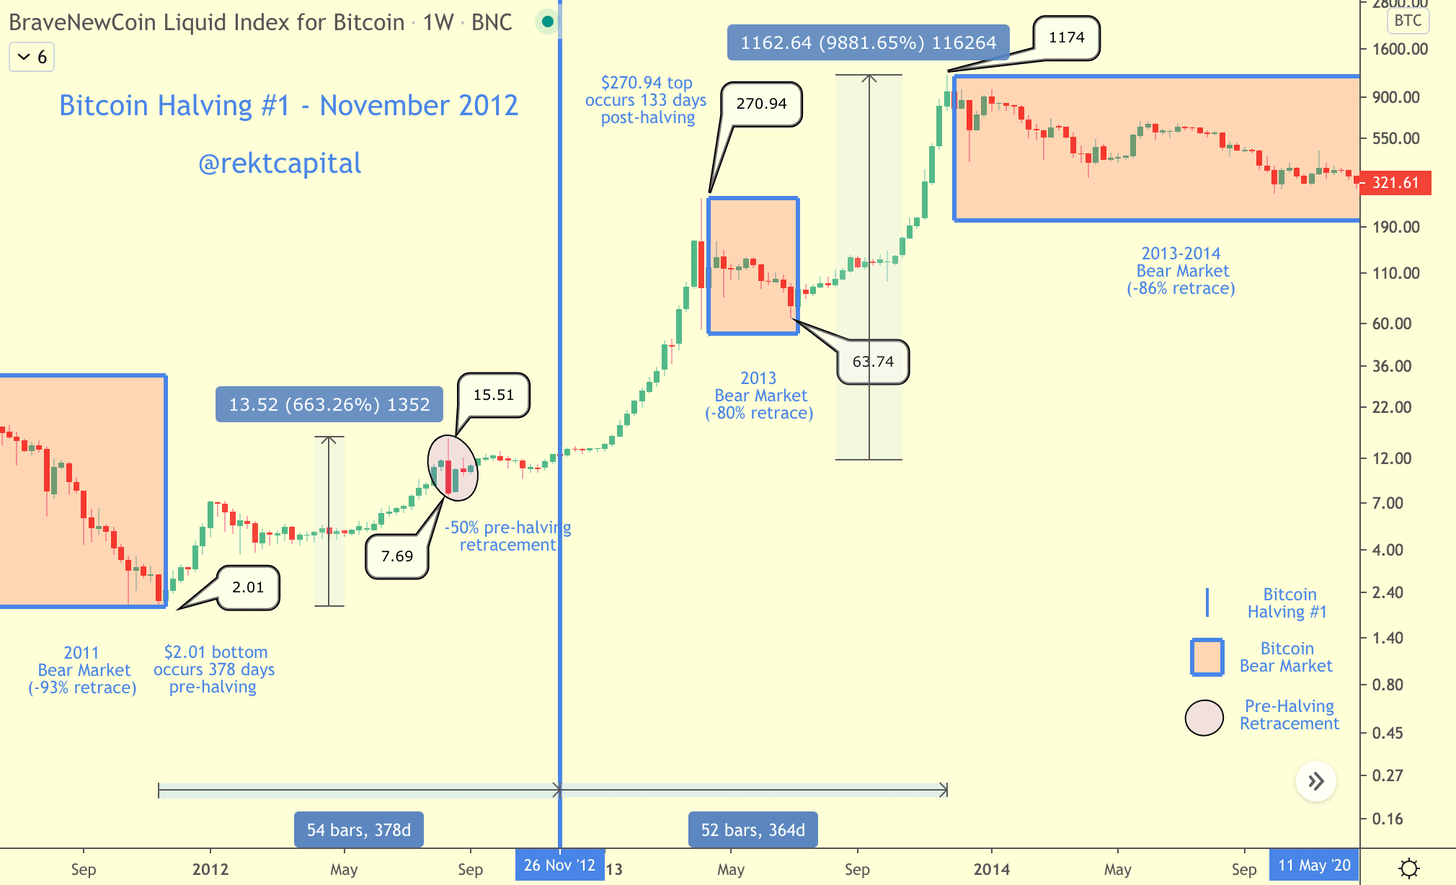
Therefore the second Bitcoin price deviation beyond the Stock to Flow that we’ll be looking at represents the first post-Halving uptrend before the first post-Halving crash.
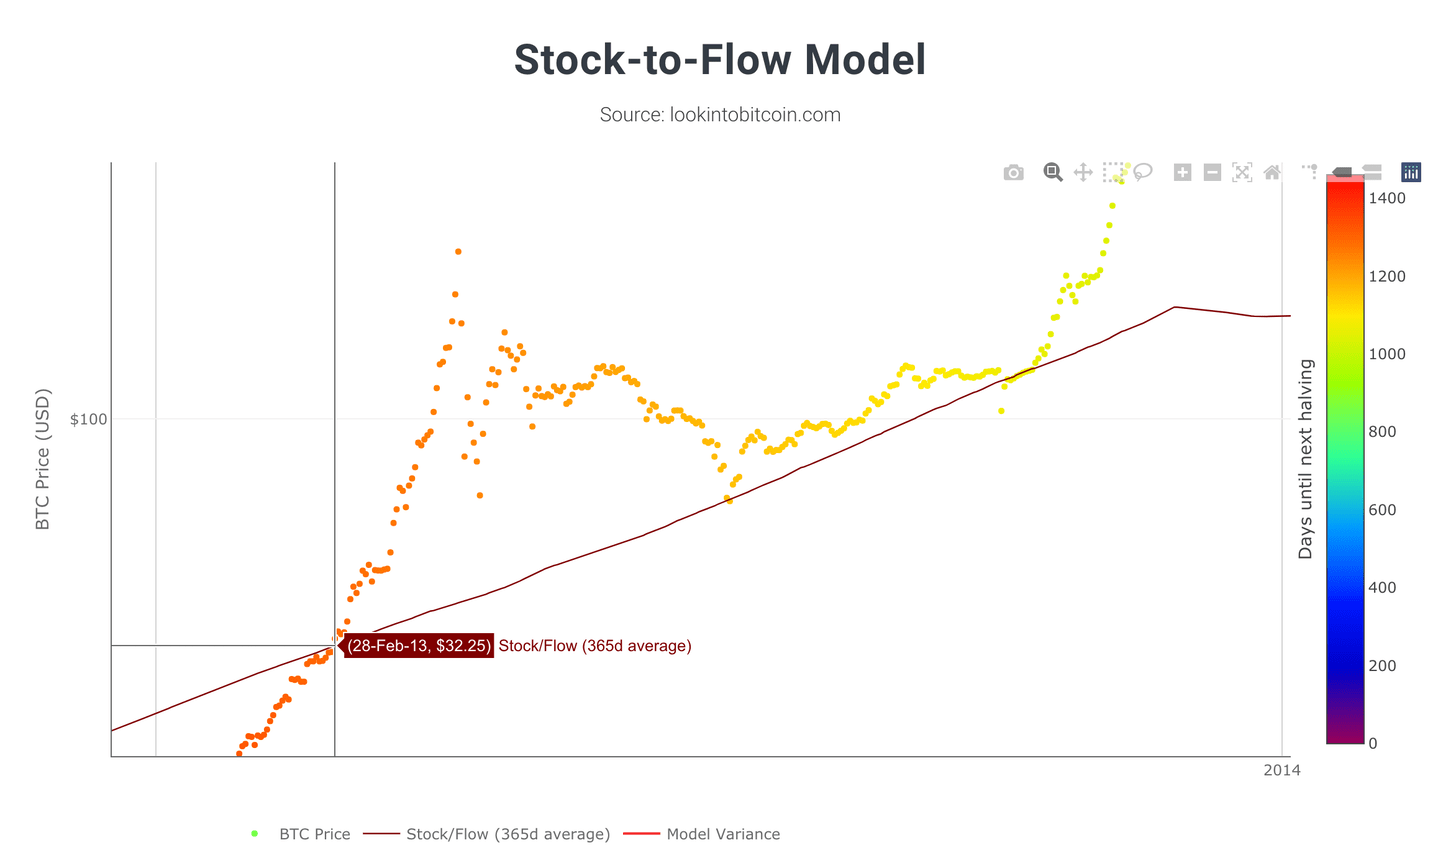
On the 28th of February 2013, Bitcoin’s price was at $32.25 when it broke past the Stock to Flow line:
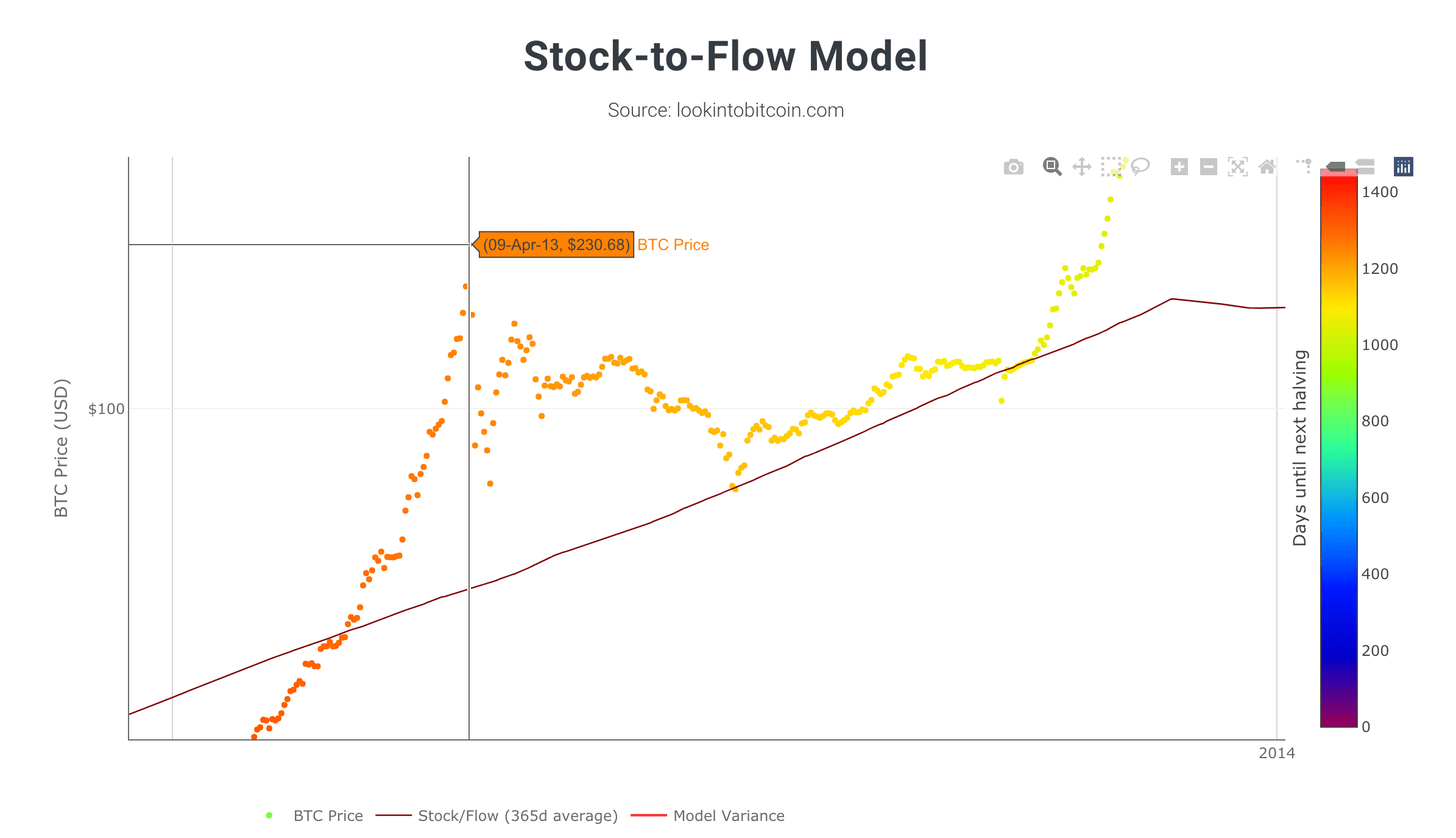
After breaking the Stock to Flow line, Bitcoin’s price rallied exponentially to a peak of $230.68 on the 9th of April 2013:
When Bitcoin peaked in its uptrend, the Stock to Flow line was now at $39.95:
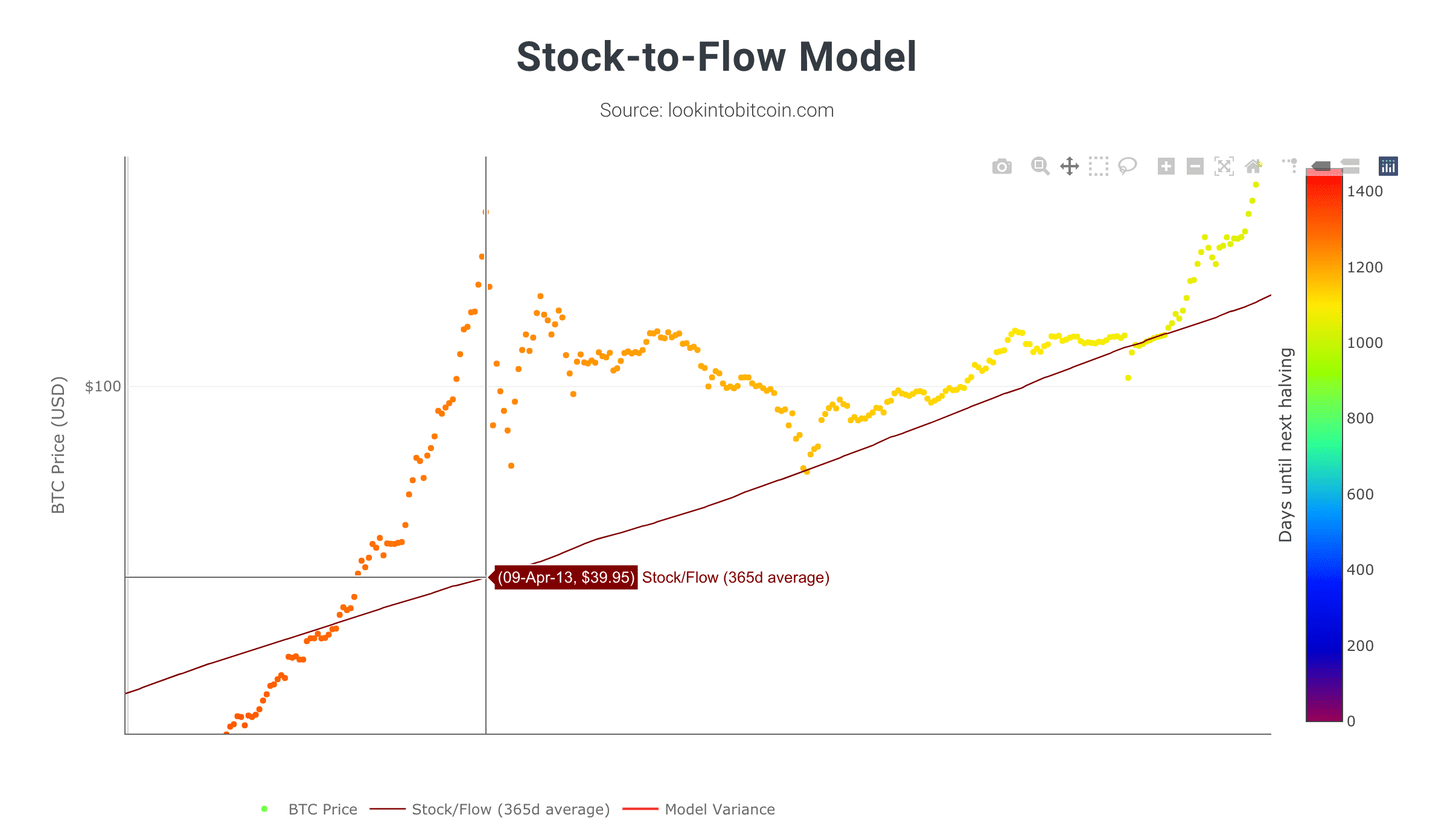
In the span of a few months from late February 2013 to early April 2013, the Bitcoin price point that the Stock to Flow outlined increased by a few dollars (i.e. from $32.25 to $39.95).
But most importantly – Bitcoin’s price rallied approximately +477% beyond the Stock to Flow line:
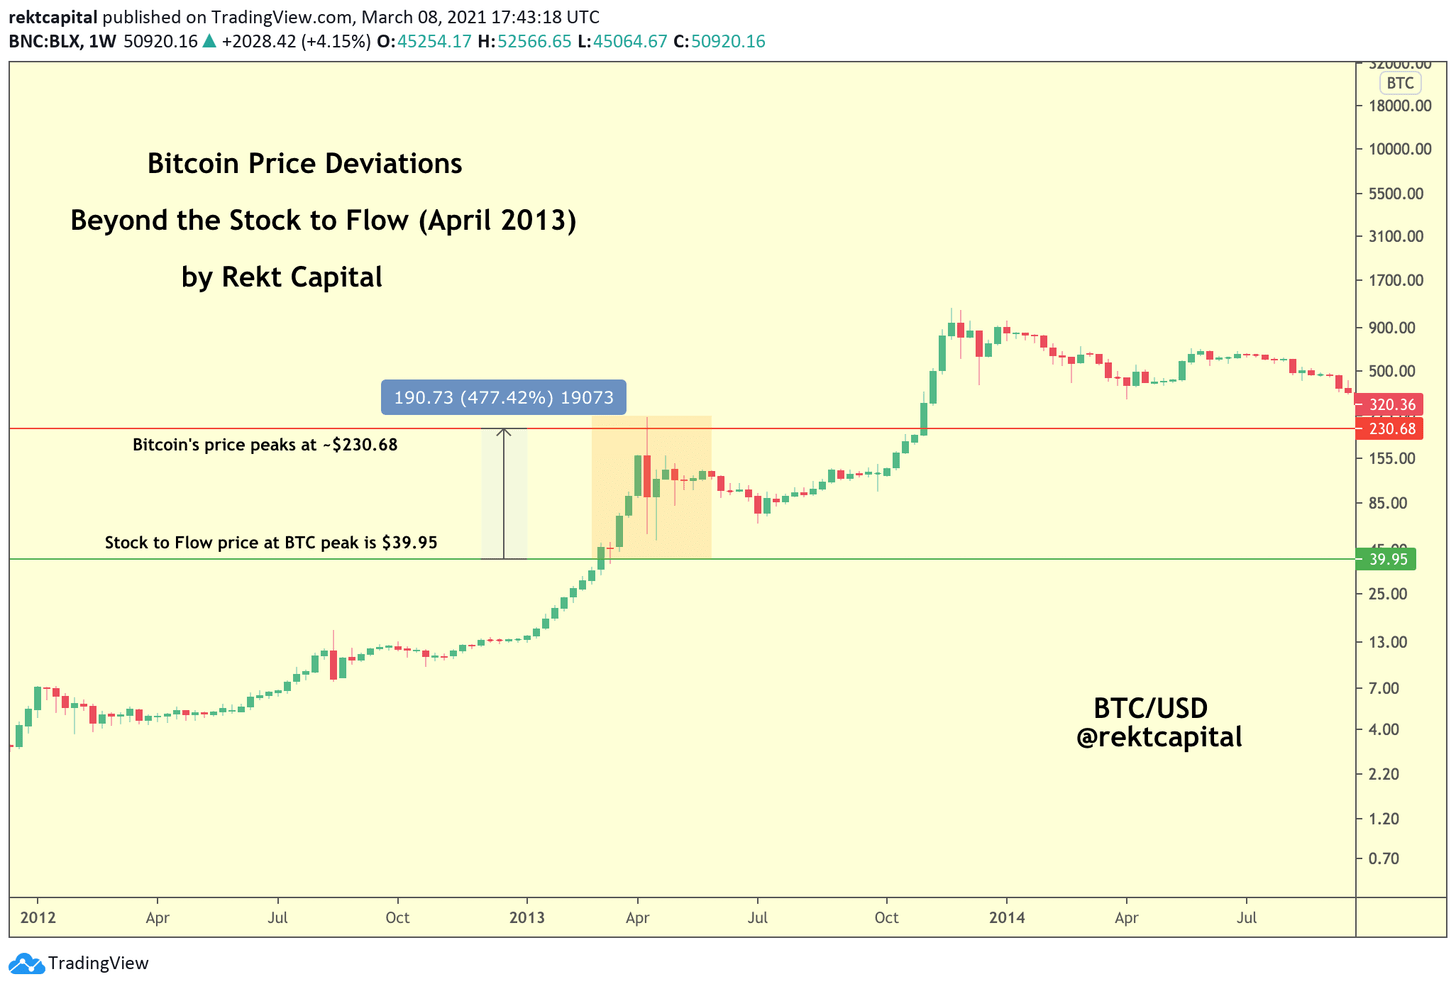
That is, Bitcoin deviated towards the upside beyond the Stock to Flow line by +477%. And once Bitcoin peaked at $230.68 in April 2013, Bitcoin entered a multi-week Bear Market where Bitcoin’s price corrected -80%.
But what’s curious is that on July 6th (2013) this Bear Market bottomed on the Stock to Flow line at $66.34:
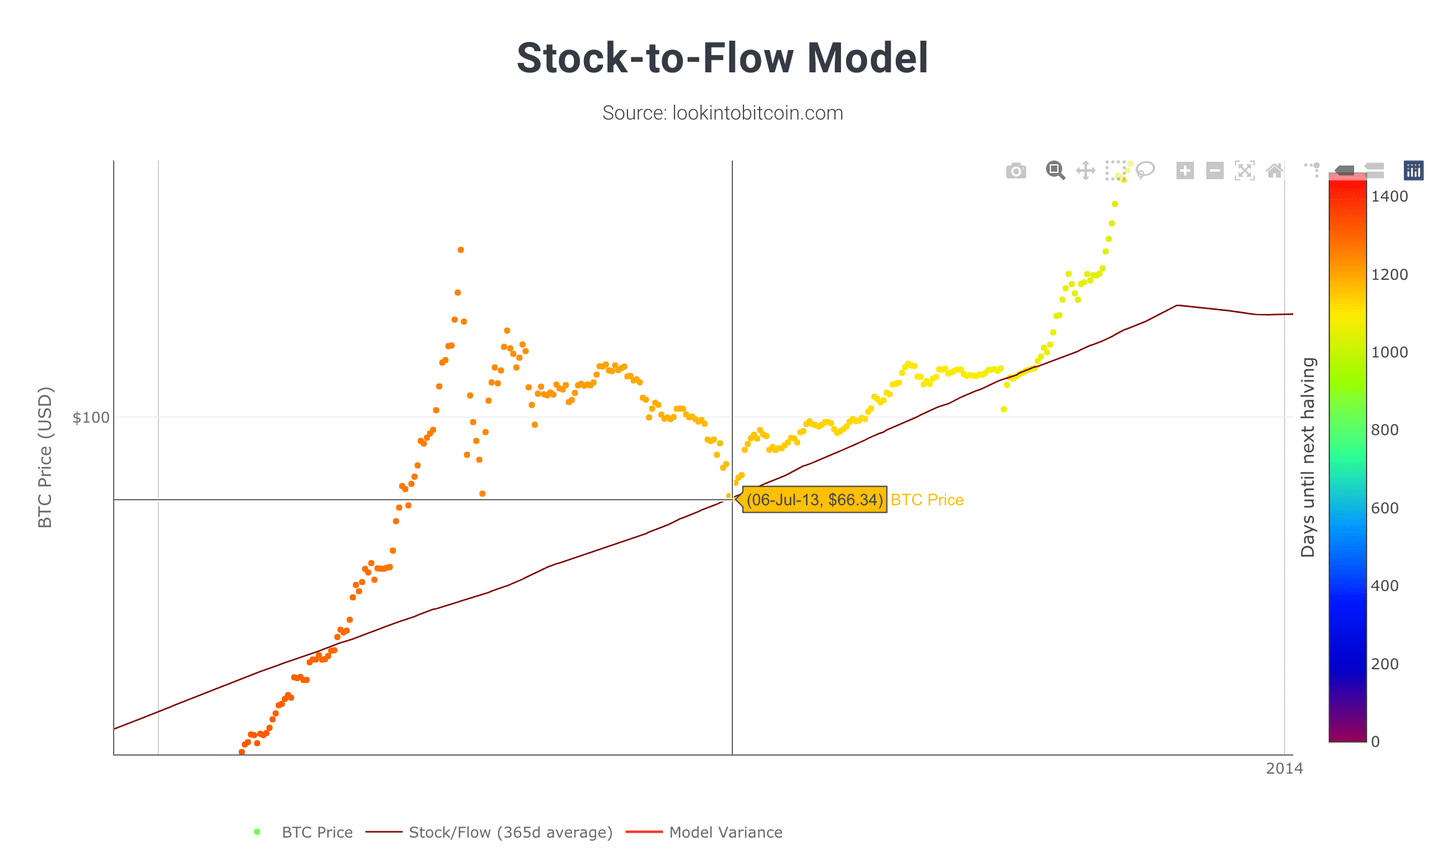
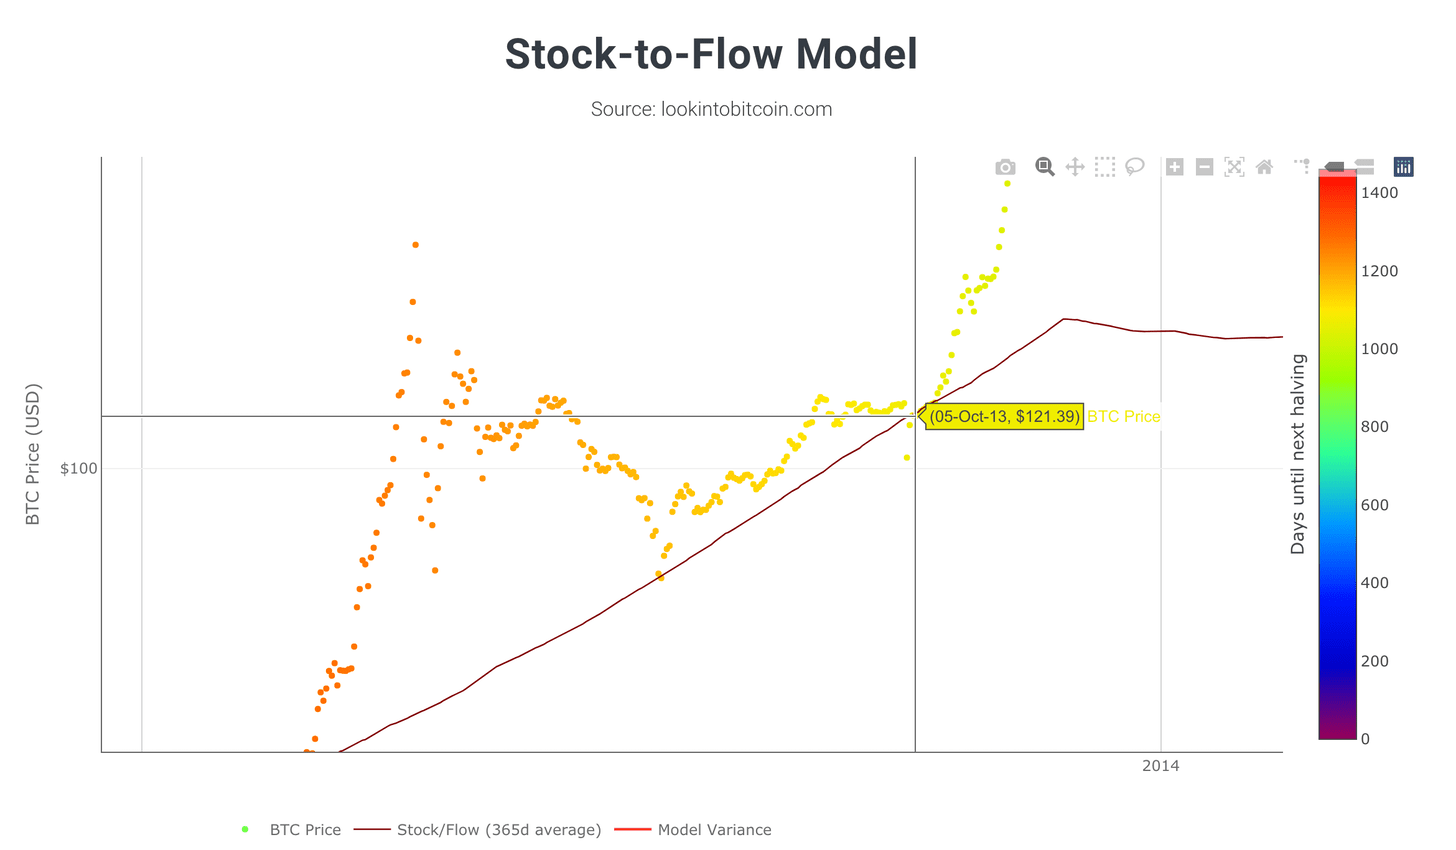
Bitcoin’s price actually rebounded from the Stock to Flow line, before once again touching and rebounding from it again on October 5th 2013 (despite a brief downside wick below the Stock to Flow line occurring a few days earlier):
Interestingly, the Stock to Flow line figured as a dynamic support, playing a pivotal role in forming a Higher Low in Bitcoin’s price after its Bear Market. This Higher Low would eventually translate into a new Bull Market uptrend for Bitcoin’s price.
The idea that the Stock to Flow line may act as a dynamic point of bullish price reversal (i.e. area of support) and bearish price rejection (i.e. area of resistance) for Bitcoin will be explored in detail at a later date.
3. Third Stock to Flow Upside Deviation (Bitcoin Bull Market Peak, December 2013)
Here’s the third time that Bitcoin’s price deviated to the upside, beyond the Stock-to-Flow line:
Recall from the previous section that Bitcoin’s Bear Market actually bottomed on the Stock to Flow line and in the several weeks afterwards – the Stock to Flow line played a pivotal role in forming the Higher Low that would kick start the next Bitcoin uptrend.
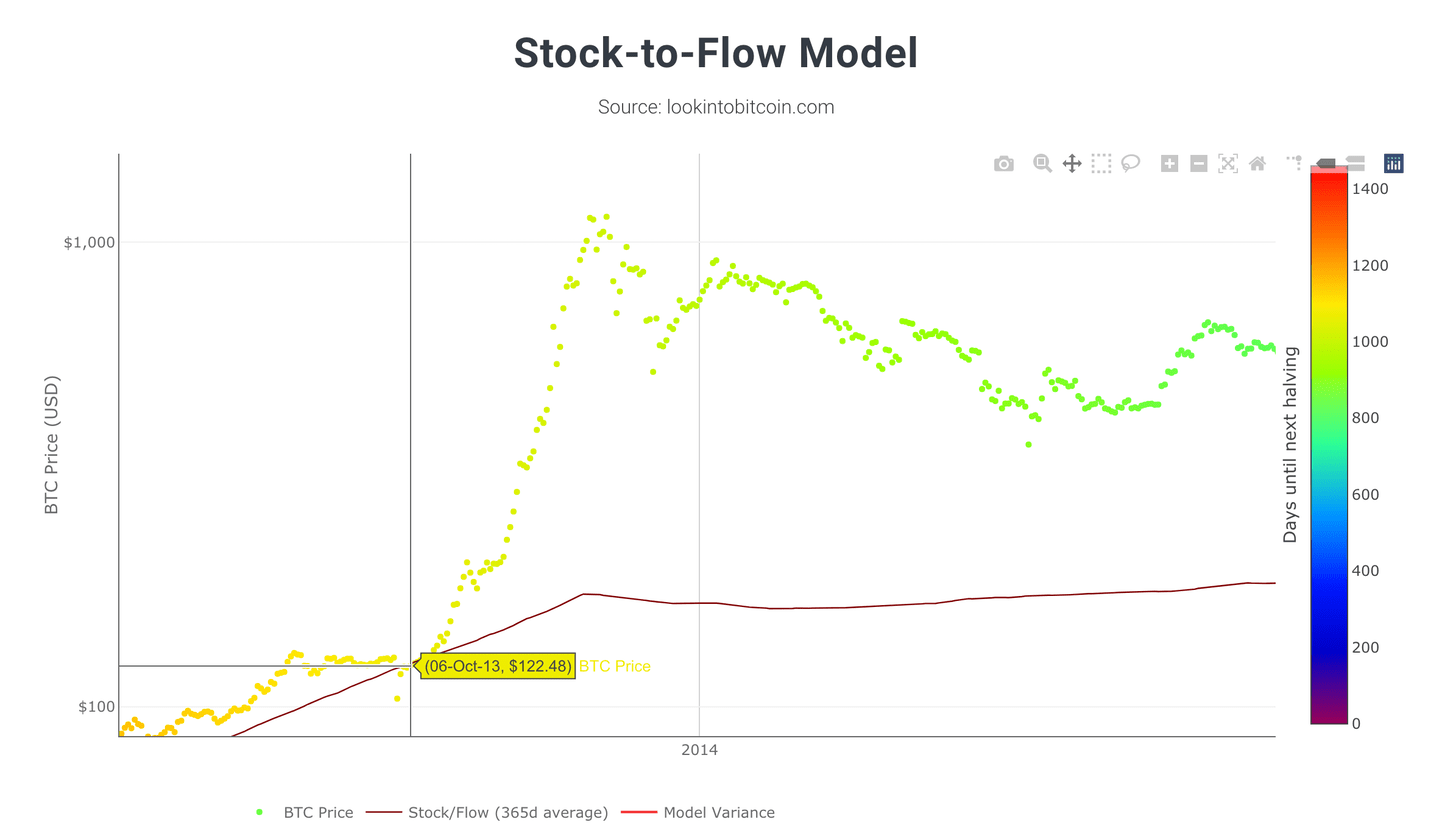
This third Bitcoin price deviation beyond the Stock to Flow line begins as Bitcoin holds the S2F line as support in early October 2013, when Bitcoin’s price was at approximately $122:
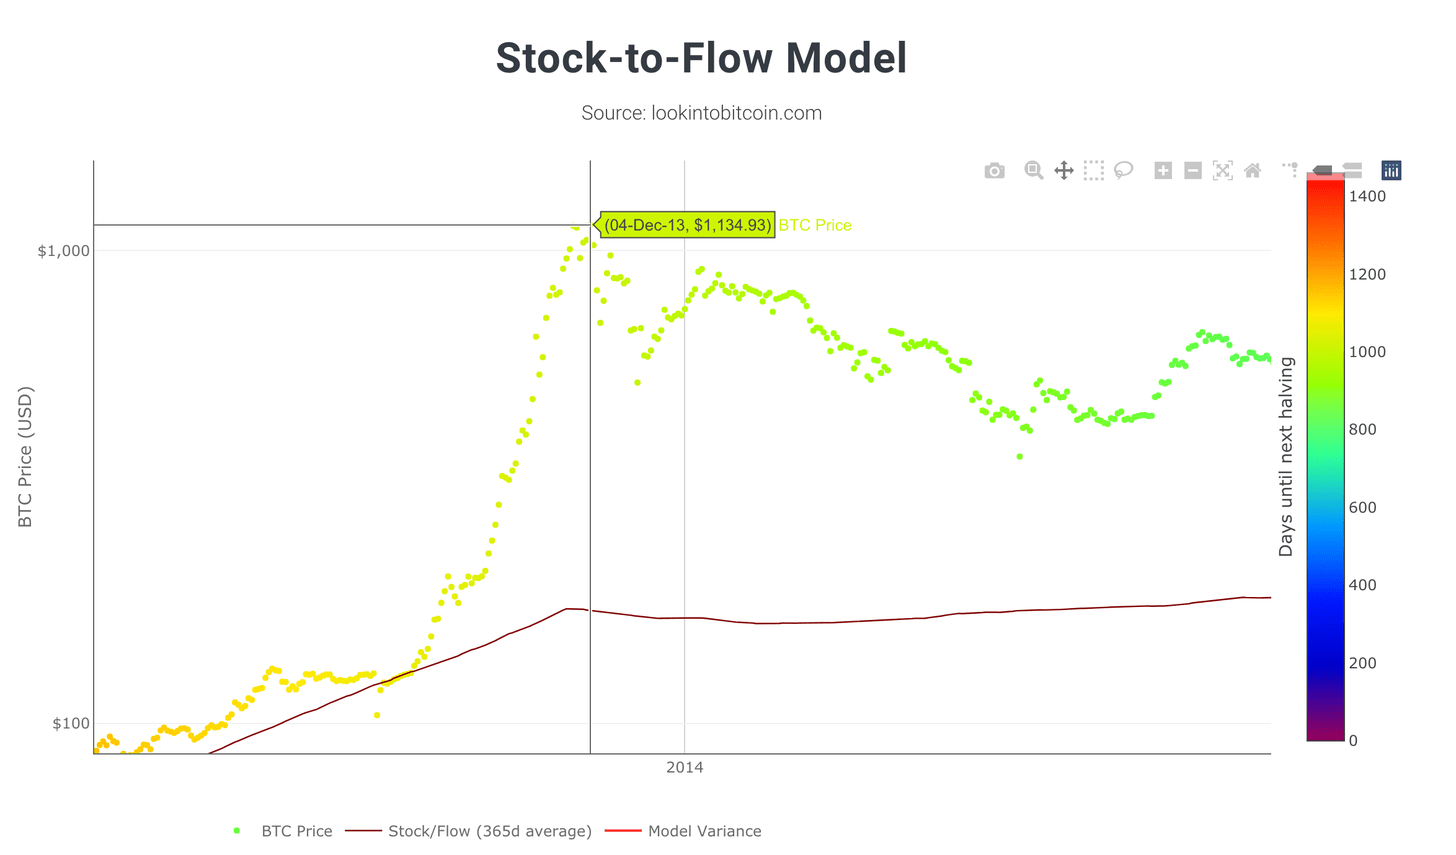
In its new Bull Market uptrend, Bitcoin then rallies exponentially to a new All Time High of $1134.93:
When Bitcoin peaked in this uptrend, the Stock to Flow line was now at $173.41:
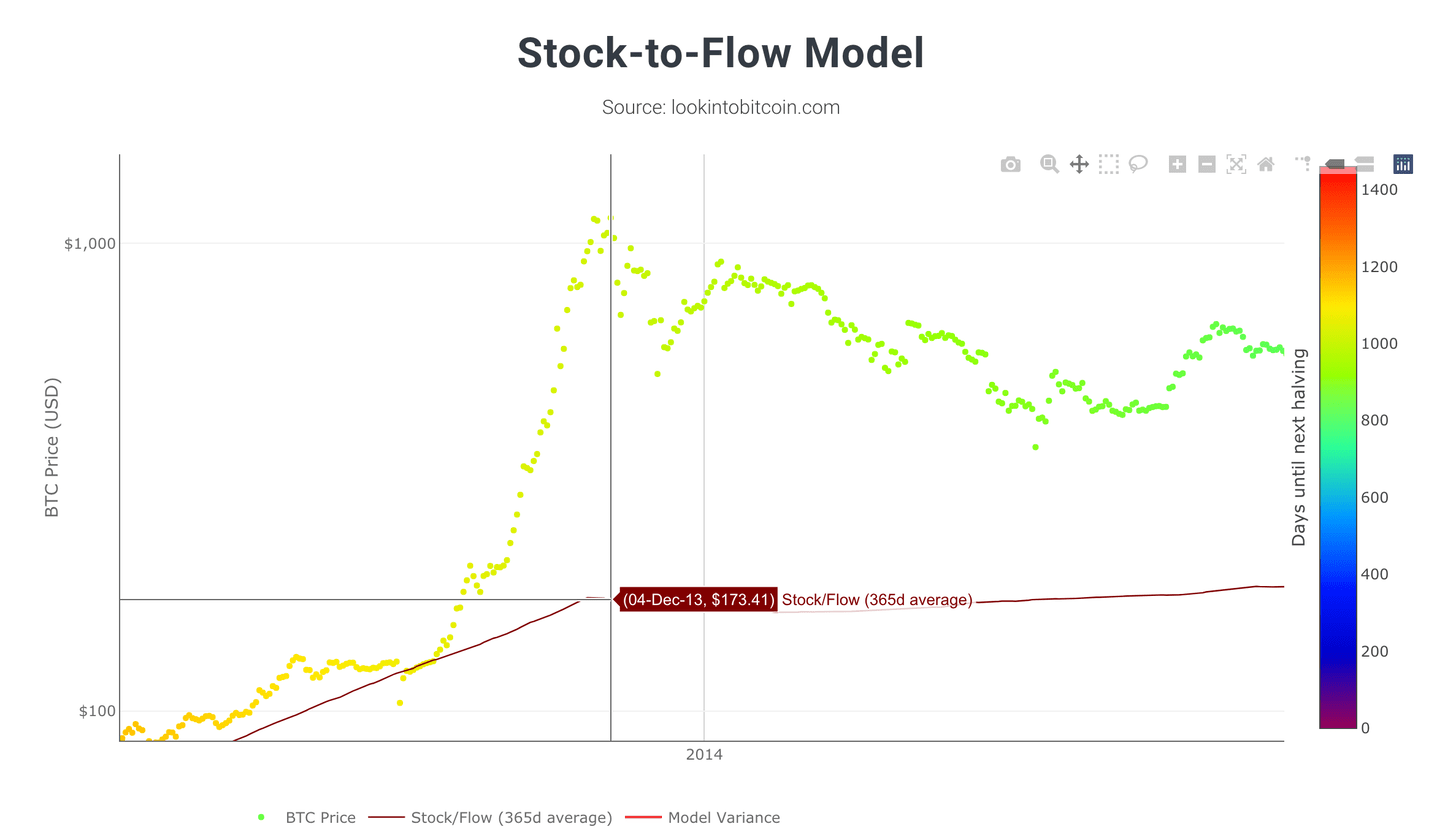
This means that Bitcoin’s price rallied approximately +554% beyond the Stock to Flow line:

Closing Thoughts
This is Part 1 of the Stock to Flow series where we’ve discussed the first three major upside Bitcoin price deviations from the Stock to Flow line:
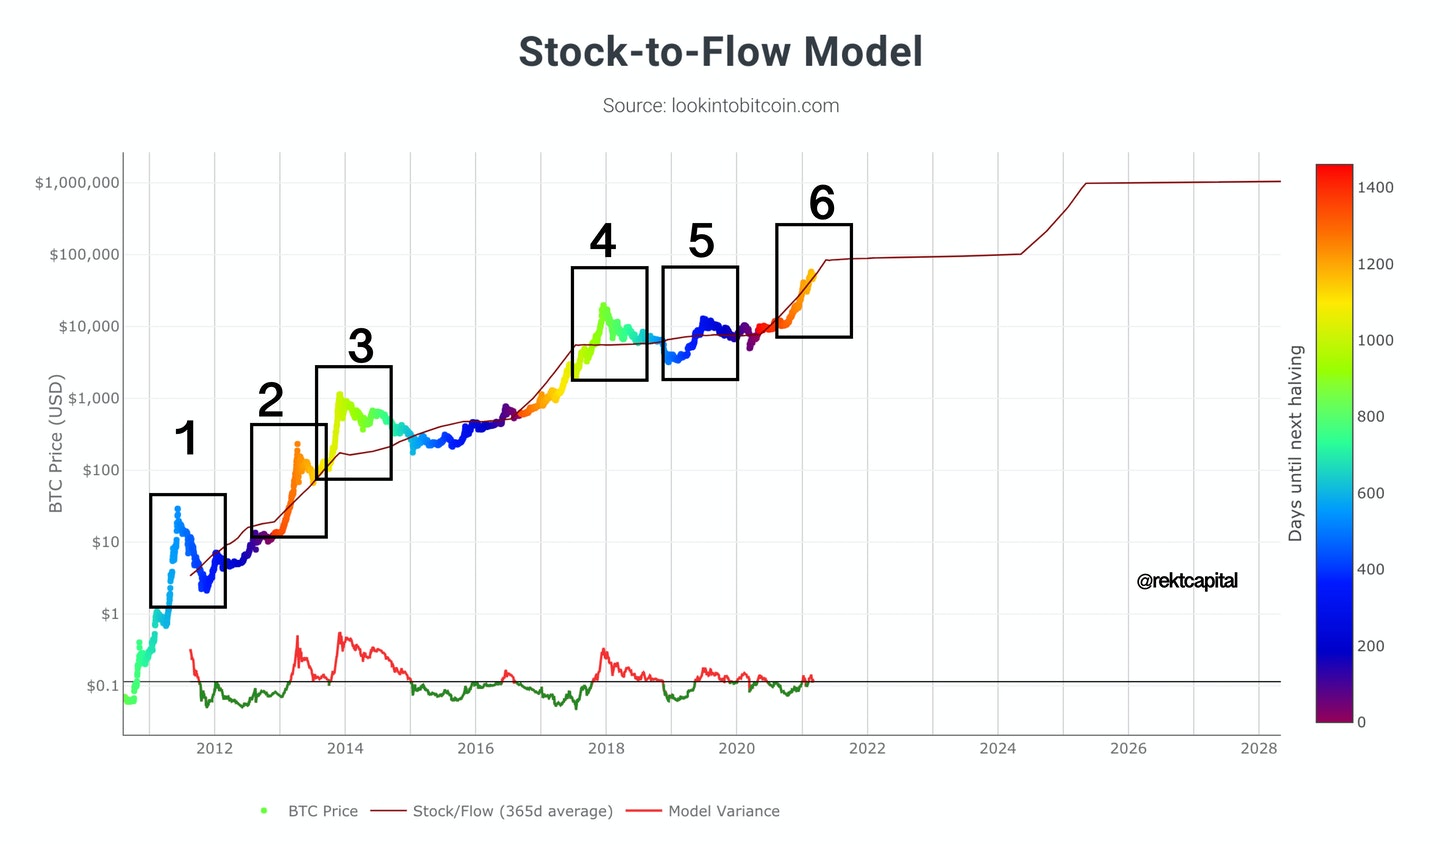
In Part 2 of this Stock to Flow series, we’ll cover the remaining three upside deviations from the Stock to Flow line in an effort to deduce where the upcoming Bitcoin price peak may take place.
Part 2 coming soon. Feel free to Subscribe to the Rekt Capital newsletter for $6.99 a month.

 Brave New Coin reaches 1M+ engaged crypto enthusiasts a month through our website, podcast, newsletters, and YouTube. Get your brand in front of key decision-makers and early adopters in 2026. Limited slots remaining! Find out more today!


