Flow Trading – How To Read Order Flow

![]()
With crypto markets primarily driven by technical analysis and the abundance of charting software available, the order book is a powerful tool for gauging the probabilities of market direction. Reading buy and sell demand on the book is called 'order flow' which can help day traders scalping the market to improve on entries, and, in a market notorious for fake volumes, it can help all types of traders identify spoof orders.
Order flow, or "reading the tape", is one of the oldest stock trading techniques used typically by day traders or "scalpers" who enter many short-term trades for a few points each time. Flow trading can be used alongside technical analysis to define entries and exits, to determine whether to use market or limit orders instead of using arbitrary entries and stop losses, and help manage a trade by gauging the probabilities of price reversing against you.
Technical analysis fulfills our innate human desire to see patterns in randomness – a psychological phenomenon known as pareidolia – and labelling them in the self-fulfilling patterns we see as head and shoulders, triangles etc. If trading purely off chart patterns (and not accounting for probability) you’re trading on a belief of what you think will happen next.
What Is Order Flow Trading?
Order flow trading is used by institutional and high frequency traders who are less interested in the array of indicators and charting software that retail traders get swamped with and are more concerned with supply and demand.
It is most commonly used in large liquid markets, like US treasuries and futures, where traders will even trade purely off the book and ignore charts altogether. For most retail traders order flow trading will be discretionary, as trying to automate the trading rules in code requires a high proficiency in programming.
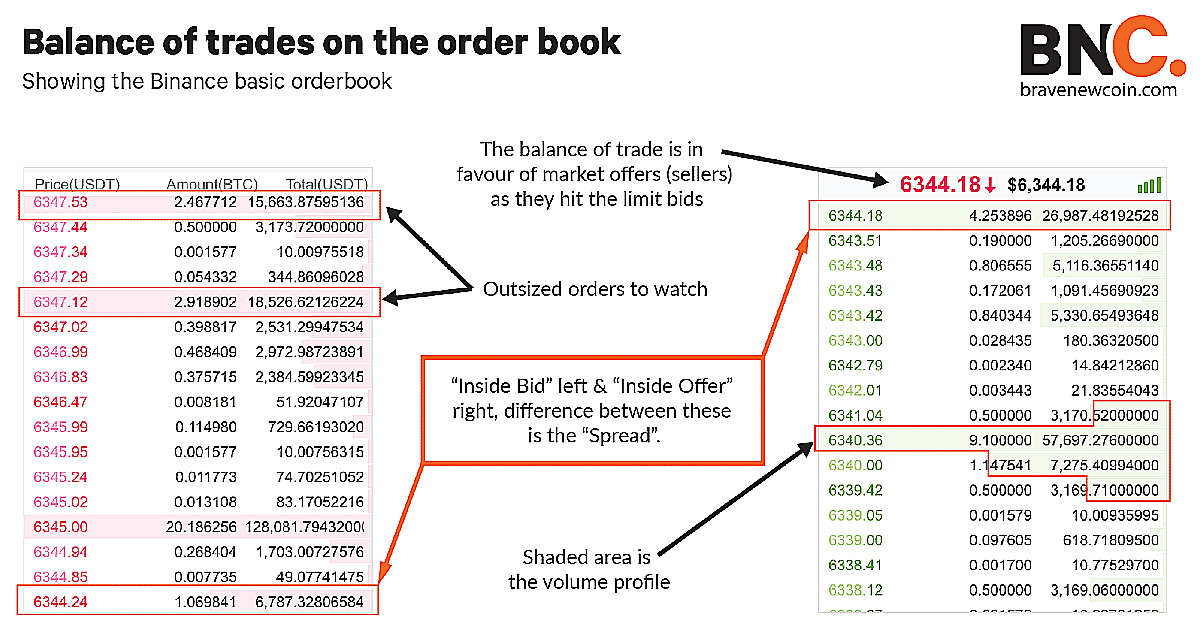 Limit orders on the book run in order from the lowest price demanded by a seller or "inside offer" (bottom left) and the highest price a buyer is willing to buy at, "inside bid" (top right). The spot price (large print) turns green when limit sell orders are met (bullish) and turns red when limit buy orders are met (bearish). Screenshot from Binance.
How To Read Order Flow
At a glance the order book provides the depth of supply (ask/offer) and demand (bid) in the market, also known as the depth of market (DOM). Reading deeper, it shows price ranges where there is support and resistance (volume profiles in the shaded green and red bars) that one can use for better entries and exits for picking potential points of reversal.
Using the order book in place of stop losses
When day trading, picking entries and exits at tight spreads is key to maximizing Satoshis, or SATs – the smallest fraction of a bitcoin, 0.00000001BTC – and unlike position or swing trading, using stop losses when scalping can be counterproductive. Reading and anticipating market flow can get you out of a trade before it goes against you and giving back SATs to a stop loss. This is also the premise high-frequency trading operates on.
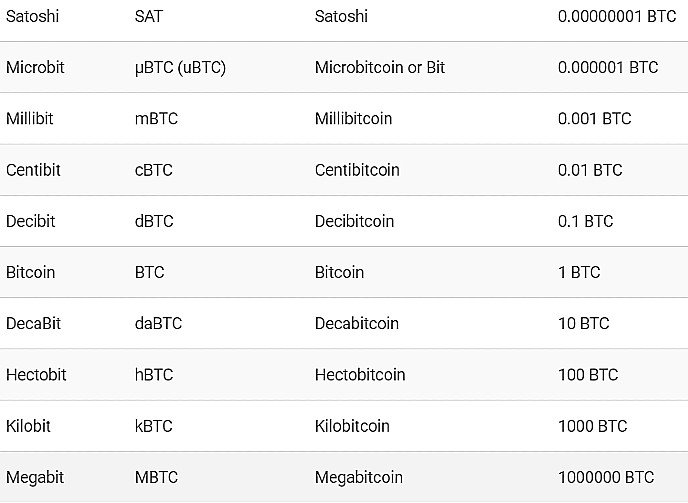 A vernacular of all the decimal places when trading in bitcoin as the quote currency eg LTC/BTC. Satoshi is the most commonly used unit.
The book only displays limit orders (known on crypto platforms as "market makers") and the market orders ("market takers") aren’t visible until a limit order is hit. Like the price haggling that takes place in a physical market between buyers and sellers, an order book shows the tug of war in price in which one side is either overwhelmed by too many sellers or too many buyers.
Support And Resistance Levels
A trader can use order flow to confirm support and resistance levels that he/she has marked on the chart. Typically, you would expect to see an accumulation of large orders around the technical levels that you have picked on the chart to confirm your thesis. However, this doesn’t mean that these levels will hold. For instance, be wary of relying on an oversized order acting as support beneath your price as this could be a spoof order.
When a trade is filled it means a limit order has been met with a market order ie. either a buyer has agreed to a seller’s limit price or vice versa. In other words;
- UPWARD buying force is created when buy market orders meet sell limit orders
- DOWNWARD selling force is created when sell market orders meet buy limit orders
Akin to poker, market orders are your hand which you won’t show until you really have to. So, if there’s a lot of buying demand you will see sell orders being taken out quickly as buyers jump in front of each other with market orders to get filled at a lower price before it continues up.
The four market forces:
- Buy limit orders (bids): Weak UP force
- Sell limit orders (offers/asks): Weak DOWN force
- Buy market orders (Buys): Strong UP force
- Sell market orders (sells): Strong DOWN force
The volume we see at a certain price on the book is the aggregate of all orders at that price, which makes it hard to tell if it’s an individual with a large account trying to move the market with a lot of size or a group of many small players scalping for some ticks. Discerning those positions is a skill acquired from reading the book which will allow you to get behind the right side of momentum.
Although the concept and look of an order book is universal across all exchanges and for all assets, it shouldn’t be read the same way for every market. Traders who trade purely on technical analysis can be missing out on a crucial part of volume of actual trading and not the volume of trades sitting on the book which can be and often are ‘spoofed’ (fake volume) and many trades are also cancelled before being filled.
The Depth of Market Chart
This is a visual representation of the volume of buy/sell orders at their respective price increments on the book, shown as a proportion of the cumulative volume of orders on either side of the book – the order book itself only shows aggregate volume. The steeper the steps the higher the volume at that price.
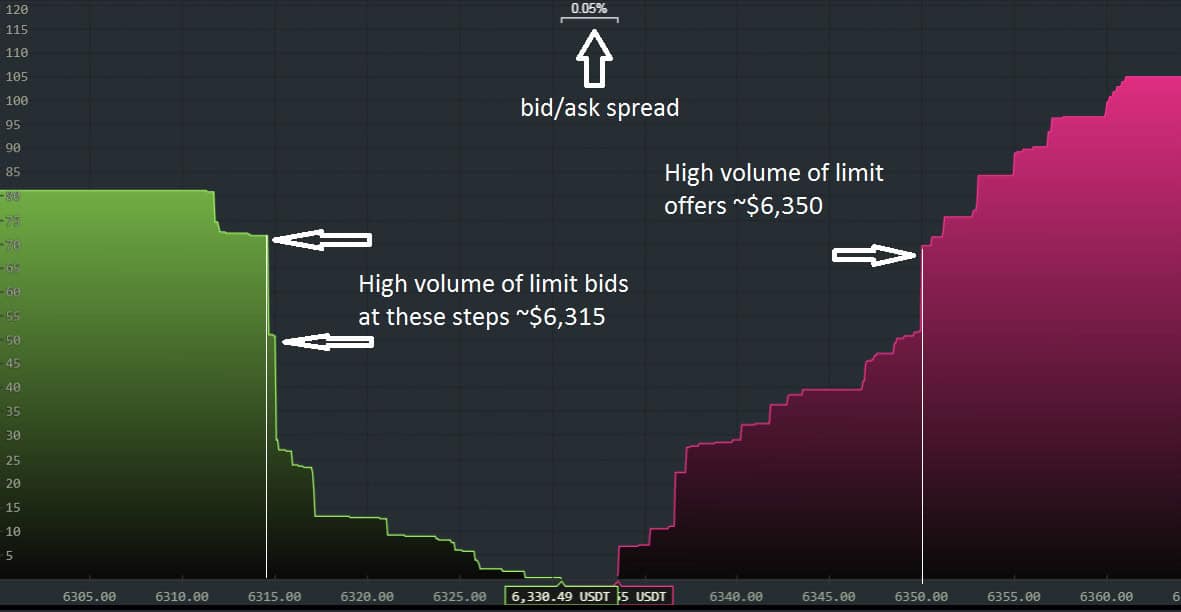
The depth of market is constantly changing as limit orders are being hit with market orders on both the buy and sell side. In this snapshot although there is more cumulative volume on the sell side there is more stopping force on the buy side with support around $6,315. (Binance)
Thin markets are more easily pushed around with bigger orders, resulting in large spikes in price. This will be accentuated in the altcoin markets where your trade size is limited.
Limit orders provide liquidity, market orders consume liquidity. So in a uptrend, buy market orders consume the liquidity (limit sell orders) above it until it hits a block of selling liquidity too big for the buy side to consume (vice versa for a downtrend), these large block orders are also known as "iceberg" orders as only part of the order is visible on the book and the rest is hidden liquidity, which can act as a stopping force for a trend reversal.
While we can’t account for these iceberg orders, a trader should watch oversized limit orders on the book with caution as sometimes when it is approaching the order will disappear at the last moment – known as a spoof order with the intent to prevent price going beyond that price.
Order book liquidity is also a core component of Brave New Coin’s Bitcoin Liquidity Index (BLX) and Ethereum Liquidity Index (ELX) which integrate order book depth from the most liquid exchanges to report a market price at which liquidity could enter or exit positions.
What the spread is saying
The spread is the widening and contracting in price difference between the highest bid price and lowest offer, also known as the inside bid and inside offer. So in a 5-tick spread, the inside bid will either have to move between 1-4 ticks (1 tick spread is the minimum possible) to tempt a market order from a seller.
Again it is a tug-of-war between market bids and market offers, the market is bullish when there are more market bids and bearish when there are more market offers – which can be thought of as the balance of trade.
Tools to complement order flow trading
Volume profiling:
Volume profiling is an add-on tool that complements order flow and offered by some exchange platforms and charting software platforms like Trading View and Sierra Chart.
The point of control (POC) and value areas (VA) are the most important metrics and a trader can look for volume accumulating in triangle patterns instead of just patterns in the candlesticks.
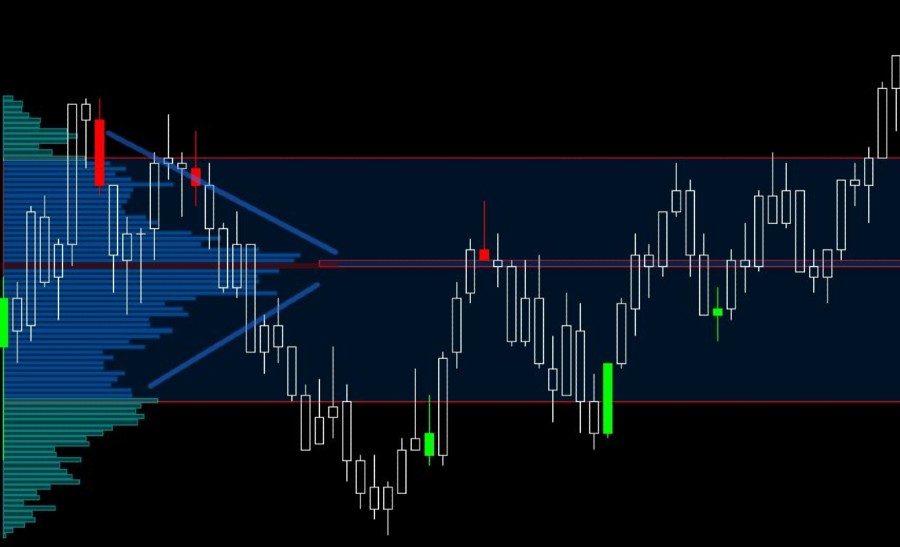
Example of volume profile accumulating on a 1 minute chart. The red line in the middle is the point of control.
Volume-weighted average price (VWAP):
VWAP is the average price of an asset traded at its average volume over a certain time period, that can be calculated intraday down to minute timeframes. It can be thought of as the price of balance of an asset, very similar to the point of control (POC) in volume profile, where volume on both sides of the VWAP are equal distance from the mean of volume.
Any price below it is considered undervalued and vice versa. It is thought to be used by institutional traders when building positions so as not to move the market with a price too far above or below the balance point. VWAP could be similarly used by retail traders in the altcoin markets that have thin liquidity.
The impact of high-frequency trading:
Although the high-frequency trading (HFT) of hedge funds and investment banks isn’t prominent in the crypto markets like it is in the equity market, the impact of algorithms and trading bots can be seen on the order book flow. With enough time a trader can become familiar with how a particular market usually trades and spot anomalies on the book – for example, if orders are being filled more rapidly or are much larger than usual.
With extremely fast orders what HFT tries to achieve is take advantage of the bid-ask spread for essentially a risk-free trade. For example, in the bitcoin market, if bid orders are being hit at $6,400 (by sellers) in quick succession, the probability is that price will keep going down to $6,350 (providing there is more ask depth than bid depth). What a HFT programme will do is fire a sell order within microseconds of that $6,400 bid order being hit, just as it’s being withdrawn from the market. This puts them in an immediate breakeven position and essentially a risk-free trade.
When HFT migrates to crypto it will change the game for day traders and order flow interpretation will require faster anticipation of which direction the market will go in the next 20 trades.
High-frequency trading programmes are tuned for ranging markets but if a market breaks out in a particular direction HFTs accentuate the trend through a cascade effect which sets off other HFT programmes to buy or sell into that trend.
Conclusion
Although technical analysis is sometimes enough to trade off, it is important to keep in mind that people, not patterns, move the markets and spotting a pattern is just one step in the process of identifying a trade. There is always a two-way bet going on any pattern and watching order flow can show the probability in which direction it will break.
In a market notorious for trade washing, getting a feel for spoof orders will only come with time and familiarity watching the book.
 Brave New Coin reaches 1M+ engaged crypto enthusiasts a month through our website, podcast, newsletters, and YouTube. Get your brand in front of key decision-makers and early adopters in 2026. Limited slots remaining! Find out more today!


