Bitcoin price analysis — A slow week in bitcoin
The technical setups posted below use simple trend detection, support and resistance, channels, pattern and candlestick analysis. We aim for high-probability trade setups on BTCUSD and use very few indicators. All charts use BNC’s Bitcoin Liquid Index for maximum accuracy.
The technical setups posted below use simple trend detection, support and resistance, channels, pattern and candlestick analysis. We aim for high-probability trade setups on BTCUSD and use very few indicators. All charts use BNC’s Bitcoin Liquid Index for maximum accuracy.
The timeframe for trades is 1 to 7 days, so we’ll use 4h candlesticks. Bitcoin is best traded as a purely speculative commodity on 4h+ timeframes.
Market Sentiment And Macro Key Points
This section is an overview of news headlines or events that may affect BTCUSD.
-
Blockstream has successfully tested the Bitcoin Lightening network. The Network tackles bitcoin scaling issues. It’s one of the first implementations of a multi-party Smart Contract using bitcoin’s built-in scripting.
-
CodeValley opened it’s Marketplace, ushering in a new style of programming with the help of bitcoin, while Kim Dotcom launches a crowdfund for Megaupload 2.0.
-
Needham, an investment and asset management firm increased their price target for Bitcoin from $655. to $848, praising the Bitcoin Core Scaling Roadmap.
Long Term Outlook
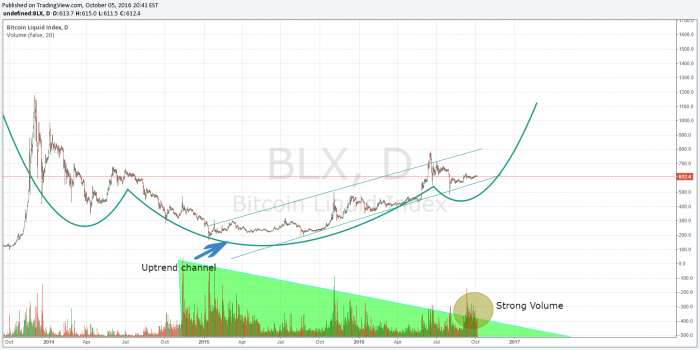
This week’s chart shows little change from last week. The price has broken out of its $590-$610 range, making consistent higher highs and lows on the daily chart, which is a solid bullish signal. The inverse head and shoulders pattern also supports a bullish outlook, while price consolidates in the lower part of the trend line. It’s important that overall volume remains strong which is a good sign that price should advance to the upside once sellers get exhausted.
Long Term Trade Idea
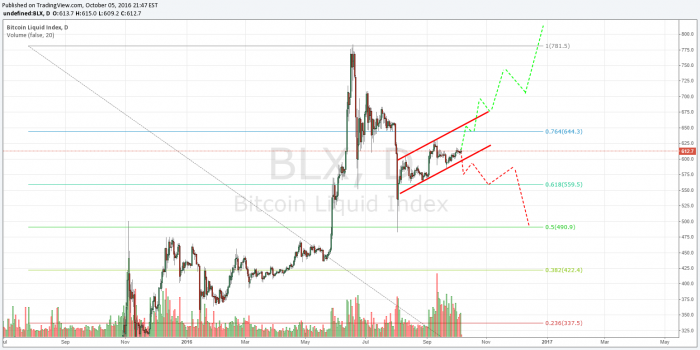
Now that we’ve broken out of the $590-610 range, there is a favorable risk reward ratio for buying into the market at the price ~$610. $600 would make an appropriate stop loss, as it’s the lower trend line support. Should the price test and break below $600.00 dollars in the coming days, a panic sell off down to $560 is likely in the near term. Although that situation is unlikely, it’s important to note.
Short Term Trade Idea
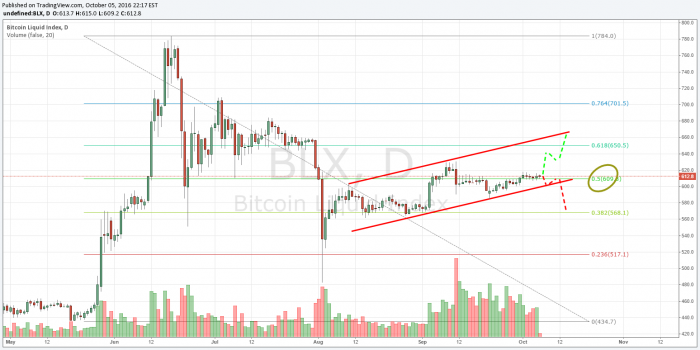
The short term chart shows that price break, and consolidation, above the 50% Fibonacci level of $610. The price needs to hold above this level to see further gains to the upside. The next resistance level is $650-$660, support is $570.00 in the near.
Conclusion
The long term chart shows several bullish signals, and a push higher is likely. Fundamental indicators also appear positive, with scaling solutions on the horizon.
Disclaimer: The information presented in this article is general information only. Information provided on, and available from, this website does not constitute any investment recommendation.
Nathaniel Freire is a full time day trader trading Digital Assets, Forex and Stocks. Based in New Jersey, Nathaniel Freire specializes in technical analysis with a twist of social sentiment and fundamental analysis. You can follow Nathaniel on Twitter @Cryptocoinrun

Don’t miss out – Find out more today


