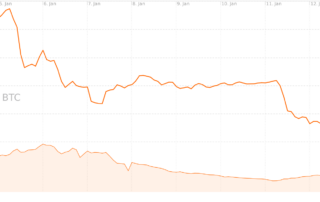
Terra Failure Triggers Crypto Price Crash
Terra founder Do Kwon has announced community voting has started on a rescue proposal for the Terra ecosystem
Data Snippet – Bitcoin price crash before the halving
The bitcoin halving took place on 11th May 2020, around 07:23 pm UTC. The block reward dropped for the third time in the history of the Bitcoin blockchain.
Data Snippet – Bitcoin volatility surges past previous high
Bitcoin's price volatility has continued to rise since it surpassed 2018's high in mid-March.
Bitcoin Price Analysis – SEC in control
Repeated Yuan devaluations recently helped the price of bitcoin break all-time highs on Chinese exchanges. The People's Bank of China (PBoC) monetary policy has likely contributed in several ways, spurring capital flight and safe-haven asset seeking.
Chinese Central Bank turns attention to bitcoin exchanges; Price plummets
The price of bitcoin has fallen by a third since peaking above US$1100 early in the year. The precipitous drop was accelerated on Wednesday as the People’s Bank of China (PBoC) announced a surprise inspection of the three major Chinese bitcoin exchanges, BTC China, OKCoin, and Huobi. The price plunged from $917 to $760 over nine frantic hours, and has dropped further since.
Bitcoin’s 8th birthday present, a stable $1000
The very first block of the blockchain, Bitcoin’s [Genesis Block](https://blockchain.info/block-index/14849), was mined by Satoshi on January 3rd, 2009. In the eight years since, bitcoin has grown from a valueless libertarian fantasy to crossing the US$1,000 line on Jan 1st. Since that time, bitcoin’s price has tested its’ new floor several times and mostly stayed above it, using the round-numbered level as a solid platform to build on.
Bitcoin Price Analysis — Bullish consolidation
Price has remained in the long term uptrend and we remain bullish. There may be a pullback in the short term, to $750, before heading back up to new highs, above $850.00. Momentum has been in consolidation and should break out soon.
Bitcoin price analysis – Retarget
The technical setups posted below use simple trend detection, support and resistance, channels, pattern and candlestick analysis. We aim for high-probability trade setups on BTCUSD and use very few indicators. All charts use BNC’s Bitcoin Liquid Index for maximum accuracy.
Bitcoin Price Analysis — Gearing up for the move ahead
The long term Bitcoin chart is extremely bullish, with solid support for the current bull market on the form of extreme volume. That being said, Bitcoin is showing some short term divergence that needs to be resolved before the trend continues.
Bitcoin price analysis — A slow week in bitcoin
The technical setups posted below use simple trend detection, support and resistance, channels, pattern and candlestick analysis. We aim for high-probability trade setups on BTCUSD and use very few indicators. All charts use BNC’s Bitcoin Liquid Index for maximum accuracy.
Bitcoin Price Analysis — Here Comes The Breakout
The technical setups posted below use simple trend detection, support and resistance, channels, pattern and candlestick analysis. We aim for high-probability trade setups on BTCUSD and use very few indicators. All charts use BNC’s Bitcoin Liquid Index for maximum accuracy.
Crypto assets overview – Sep 11, 2016
A steady week in bitcoin ended preceded a drop of almost 5% overnight. The Bitcoin price was bullish the entire week, starting at $609, but ends the week at $602. 80% of Bitcoin trading volume is in CNY, followed by 11% in JPY. USD is 3rd with 5.6%. More detailed information can be found in the Bitcoin technical analysis.
Bitcoin Price Analysis – Bullish channel continues to hold
The technical setups posted below use simple trend detection, support and resistance, channels, pattern and candlestick analysis. We aim for high-probability trade setups on BTCUSD and use very few indicators. All charts use BNC’s Bitcoin Liquid Index for maximum accuracy.
Bitcoin Price Analysis — Selling pressure continues
The technical setups posted below use simple trend detection, support and resistance, channels, pattern and candlestick analysis. We aim for high-probability trade setups on BTCUSD and use very few indicators. All charts use BNC’s Bitcoin Liquid Index for maximum accuracy.
Bitcoin Price Analysis — Long term buy, short term hold
The technical setups posted below use simple trend detection, support and resistance, channels, pattern and candlestick analysis. We aim for high-probability trade setups on BTCUSD and use very few indicators. All charts use BNC’s Bitcoin Liquid Index for maximum accuracy.
Bitcoin Price Analysis — To fork or not to fork
The technical setups posted below use simple trend detection, support and resistance, channels, pattern and candlestick analysis. We aim for high-probability trade setups on BTCUSD and use very few indicators. All charts use BNC’s [Bitcoin Liquid Index](bitcoin) for maximum accuracy.


