Bitcoin Price Analysis – Lift off
We have finally broken out of a multi month consolidation pattern which is very exciting to see. Trading these breakouts can be very profitable and very risky. Look to longer term support and resistance levels to find price targets.
The technical setups posted below use simple trend detection, support and resistance, channels, pattern and candlestick analysis. We aim for high-probability trade setups on BTCUSD and use very few indicators. All charts use BNC’s Bitcoin Liquid Index for maximum accuracy. The timeframe for trades is 1 to 7 days, so we’ll use 4h candlesticks. Bitcoin is best traded as a purely speculative commodity on 4h+ timeframes.
Market Sentiment And Macro Key Points
-
Bitcoin has officially reached an all time high in market cap at $15B+ with little sign of slowing down.
-
Trump has been appointing Bitcoin friendly people to his administration. Those people include Peter Thiel, Mick Mulvaney and others.
-
Segwit adoption looks to be posible in the future, Roger Ver was quoted in the Whalepool.io debate saying that he would signal for Segwit if it came down to 6%.
Technical Analysis
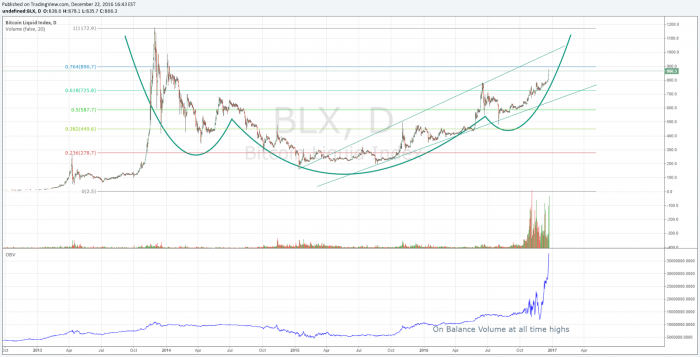
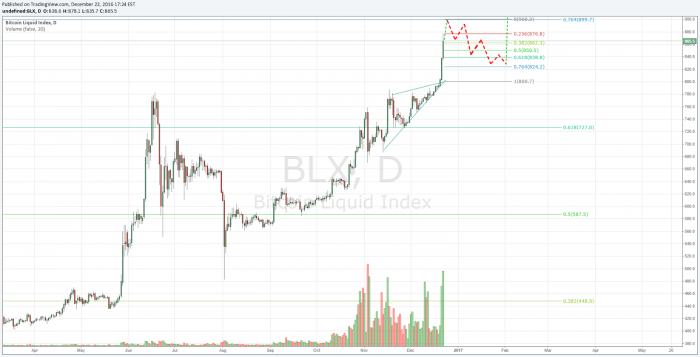
We have finally broken out to the upside in a big way. As predicted last week, we saw a potential move to the $900.00 area. The on balance volume, which measures the amount of buying pressure we are experiencing, has broken out to all time highs. This indicates that the buying pressure is strong when compared to selling. We are approaching some resistance at the $900.00 area. There are a couple of factors we are looking at that may cause a short term reversal. Long term we remain bullish and see further upside potential.
There is a weekly pivot point (resistance) at $910.00. There is also a long term .764 Fibonacci extension at $900.00. We believe that we will reach these prices in the coming days. It will be interesting to see how the price reacts to those levels. If we see a topping pattern at $900-$910 we should pull back to the $820-$830 area, as outlined in the below chart, before seeing new highs past $900.00. If you are looking for an entry we think that waiting for a pullback to the $820-$830 area would be ideal. On the contrary, If we break past $900 and hold above that level, $1000.00+ Bitcoin is on the cards.
Conclusion
We have finally broken out of a multi month consolidation pattern which is very exciting to see. Trading these breakouts can be very profitable and very risky. Look to longer term support and resistance levels to find price targets. It is very difficult to find a top in a breakout of this magnitude, so shorting during this move may be risky.
We are entering day 3 of this breakout after having 30+ days of consolidation, meaning that we are just at the beginning of this run.The Breakout in May lasted 20 days before pulling back. We think price pullbacks over the next couple weeks should be seen as buying opportunities.
Disclaimer: The information presented in this article is general information only. Information provided on, and available from, this website does not constitute any investment recommendation.
Nathaniel Freire is a full time day trader trading Digital Assets, Forex and Stocks. Based in New Jersey, Freire specializes in technical analysis with a twist of social sentiment and fundamental analysis. You can follow Nathaniel on Twitter @Cryptocoinrun

Don’t miss out – Find out more today


