Bitcoin price analysis – Retarget
The technical setups posted below use simple trend detection, support and resistance, channels, pattern and candlestick analysis. We aim for high-probability trade setups on BTCUSD and use very few indicators. All charts use BNC’s Bitcoin Liquid Index for maximum accuracy.
The technical setups posted below use simple trend detection, support and resistance, channels, pattern and candlestick analysis. We aim for high-probability trade setups on BTCUSD and use very few indicators. All charts use BNC’s Bitcoin Liquid Index for maximum accuracy.
The timeframe for trades is 1 to 7 days, so we’ll use 4h candlesticks. Bitcoin is best traded as a purely speculative commodity on 4h+ timeframes.
Market Sentiment And Macro Key Points
This section is an overview of news headlines or events that may affect BTCUSD.
-
The Yuan is continuing to experience further devaluation by the PBOC. The bitcoin price has a strong correlation with the USDCNH price.
-
Bitcoin miners will start signaling support for the long awaited Bitcoin scaling solution, Segwit, tomorrow.
-
Tullett Prebon becomes the largest interdealer broker to offer Brave New Coin digital currency data.
Long Term Technical Analysis
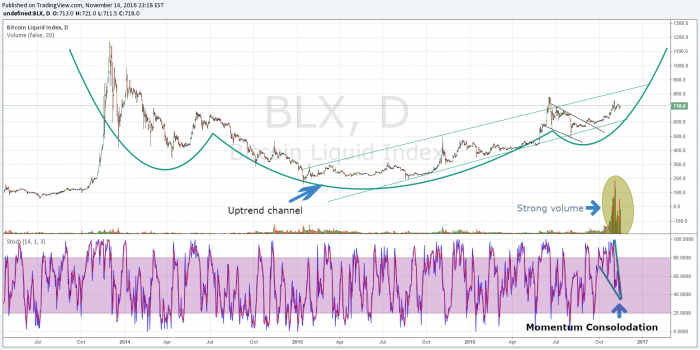
The long term chart continue to shows a bullish trend. The price of a bitcoin is still within the long term uptrend channel, and looks likely to test the top the upper bound. The Stochastic momentum indicator looks ready to break out of a consolidation pattern, which indicates near term volatility.
Long Term Trade Idea
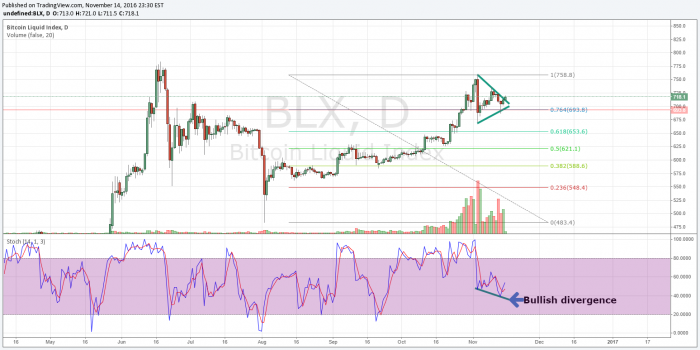
BTC price broke out out of a Bull Pennant formation today, which is a strong signal for more upside. Also, the Stochastic Momentum Oscillator indicator printed a lower low while bitcoin printed a higher low. This bullish divergence has favorable odds in resolving to the upside. If looking to go long, using the .764 Fibonacci level ($695) as a stop loss, and the test of $785 as an initial target provides better than 2:1 risk reward.
Short Term Trade Idea
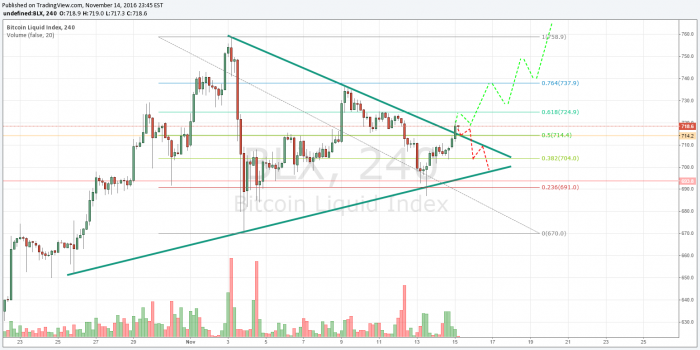
Zooming in to the 4hr chart gives us a better idea of what to expect. Of the two possibilities shown on the chart, the bullish resolution looks more likely. If looking to go long at current prices, we recommend placing stop loss orders below the 50% Fibonacci level ($714.00), and targets over $750.
Conclusion
The long term chart is still bullish and there are no indications that the trend will change. The technical indicators favour further upside, which is supported by the coming fundamental developments. With Segwit around the corner, and large institutions showing interest in Bitcoin price data, bitcoin has plenty of support.
Disclaimer: The information presented in this article is general information only. Information provided on, and available from, this website does not constitute any investment recommendation.
Nathaniel Freire is a full time day trader trading Digital Assets, Forex and Stocks. Based in New Jersey, Nathaniel Freire specializes in technical analysis with a twist of social sentiment and fundamental analysis. You can follow Nathaniel on Twitter @Cryptocoinrun

Don’t miss out – Find out more today


